Download
1 / 19
200 likes | 299 Vues
Understanding and Comparing Confocal Scanning Lasers to Optical Coherence Tomography for Optic Nerve Head Analysis (ONH) A presentation courtesy of Zeiss. Third Generation Products. LDT abandoned TopSS in 1999 to continue develop-ment of GDx Access

E N D
Understanding and Comparing Confocal Scanning Lasers to Optical Coherence Tomography for Optic Nerve Head Analysis (ONH)A presentation courtesy of Zeiss
Third Generation Products • LDT abandoned TopSS in 1999 to continue develop-ment of GDx Access • HDT released their HRT II instrument, which is smaller, faster, easier and cheaper
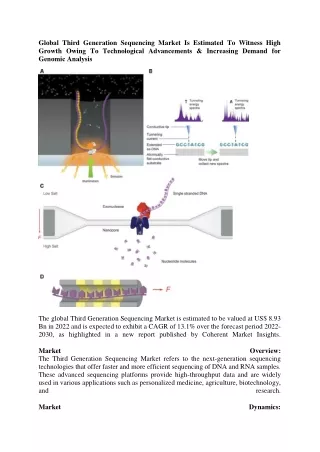
How they Work LASER FOCALPOINT PINHOLE APERTURE DETECTOR • A 670-780nm LASER light source plus (2) Pinhole (20-25 micron) apertures detect light reflected off the retina
Signal • Confocal Scanning Lasers sense the shape of the surface of the Hyloid Face or the Vitreous to Internal Limiting Membrane interface. • At this point the peak reflection is recorded • Difficulties with some common conditions as PVD can cause artifacts. • Have excellent “X-Y” resolution, but coarse “Z” resolution.
Scanning Lasers make Slices • Typically 32 “Slices” are acquired over a 4mm depth. • Each slice has a depth of 25 microns. • A non sampled gap of 100 microns is between slices. Z Y X
Scanning • Typically a 6mm by 6mm area of retinal surface is scanned. • Each slice is about 20 –25 microns thick. • Each gap between slices is about 100 microns thick. • Only a few slices fall on the ONH.
Examples of Data • Two of the 32 slices are displayed at the right. • Lets plot the paths of light of the 3 data-points. • At different areas on the disk in slice 14 of 32 notice: • Yellow is on a blood Vessel • Green is on the rim • Purple is in the cup Slice 14 of 32 Slice 18 of 32
How the slices determine topography • A graph illustrates REFLECTANCE for the same location at each of the 32 slices. Since the Yellow curve peaked before the Green or Purple curve, a RELATIVE difference in Topography can be calculated.
Establishing a Reference Plane • A Publication by Weinreb et al shows the Papilomacular bundle as an area adjacent to the rim showing the least amount of change. So these instruments use this area and other areas as a peripheral band concentric around the disk to manufacture “ZERO” or a reference plane.
Volumetric Analysis • The operator must draw the outline of the disk. • This is not easy as the image is not taken in white light. • Notice how two different operators outline the same disk with different shapes. • Volumetric parameters are operator dependent.
Optical Coherence Tomography • To scan the ONH, Optical Coherence Tomography acquires (6) 4mm long by 2mm deep “Slices” in the X-Z axis. • Datapoints are sampled every 2 microns providing excellent resolution in the Z axis. • Confocal Scanning Lasers typically sample every 100 microns. Y X Z
Image Analysis • Using a proprietary algorithm, OCT identifies the Retina Pigment Epithelium and places a marker.
The markers show the boundaries of the disk in each individual slice. The next slide shows all six slices.
ONH Tomography Examples Slice 1 Slice 4 Slice 2 Slice 5 Slice 3 Slice 6
ONH Analysis • Using the algorithm OCT objectively finds the margin of the disk. • OCT objectively finds the cup by using an offset value of 150 microns up from the RPE. • No reference plane is required.
OCT Printout • Details volumetric analysis of cup and Disk. • Provides Direct Cross Section of anatomy.
“Z” Dimension Datapoints Optical Coherence Tomography acquire 1024 datapoints over 2mm Confocal Scanning Lasers acquire 32 datapoints over 4mm
Datapoint Comparrison • Confocal Scanning Lasers have 100 micron gaps between datapoints in “Z” dimension. • Optical Coherence Tomography has only 2 micron gap. 100 Micron Gap 150 Microns
Conclusion • Confocal Scanning Laser Technology is not capable of seeing small changes in the ONH. • Glaucomatous change occurs very slowly. • Progression may not be observed with sampling points with 100 micron gaps. • OCT with higher “Z” resolution is more likely to see glaucomatous progression. • Objective placement of Cup and Disk insures accuracy between operators. • Viewing the anatomy confirms ONH Analysis from artifacts seen in confocal scanning lasers.