Download
1 / 46
570 likes | 1.09k Vues
Capnography : The Ventilation Vital Sign. Mazen Kherallah, MD FCCP Critical Care Medicine and Infectious DIsease. Objectives. Define Capnography Discuss Respiratory Cycle Discuss ways to collect ETCO2 information Discuss Non- intubated vs. intubated patient uses

E N D
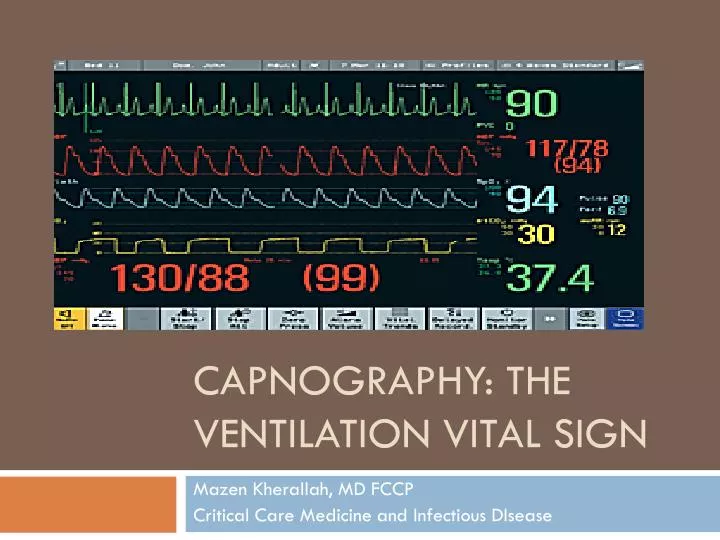
Capnography: The Ventilation Vital Sign Mazen Kherallah, MD FCCP Critical Care Medicine and Infectious DIsease
Objectives • Define Capnography • Discuss Respiratory Cycle • Discuss ways to collect ETCO2 information • Discuss Non-intubated vs. intubated patient uses • Discuss different waveforms and treatments of them.
So what is Capnograhy? • Capnography- Continuous analysis and recording of Carbon Dioxide concentrations in respiratory gases ( I.E. waveforms and numbers) • Capnometry- Analysis only of the gases no waveforms
Respiratory Cycle • Breathing- Process of moving oxygen into the body and CO2 out can be passive or non-passive. • Metabolism-Process by which an organism obtains energy by reacting O2 with glucose to obtain energy. • Aerobic- glucose+O2 = water vapor, carbon dioxide, energy (2380 kJ) • Anaerobic- glucose= alcohol, carbon dioxide, water vapor, energy (118 kJ)
Respiratory Cycle con’t • Ventilation- Rate that gases enters and leaves the lungs • Minute ventilation- Total volume of gas entering lungs per minute • Alveolar Ventilation- Volume of gas that reaches the alveoli • Dead Space Ventilation- Volume of gas that does not reach the respiratory portions ( 150 ml)
Respiratory Cycle Oxygen-> lungs -> alveoli -> blood Oxygen breath CO2 muscles + organs lungs Oxygen CO2 cells energy blood Oxygen + Glucose CO2
Respiratory Cycle ALL THREE ARE IMPORTANT! PERFUSION VENTILATION METABOLISM
How is ETCO2 Measured? • Semi-quantitative capnometry • Quantitative capnometry • Wave-form capnography
Semi-Quantitative Capnometry • Relies on pH change • Paper changes color • Purple to Brown to Yellow
Quantitative Capnometry • Absorption of infra-red light • Gas source • Side Stream • In-Line Factors in choosing device: • Warm up time • Cost • Portability
Waveform Capnometry • Adds continuous waveform display to the ETCO2 value. • Additional information in waveform shape can provide clues about causes of poor oxygenation.
Interpretation of ETCO2 • Excellent correlation between ETCO2 and cardiac output when cardiac output is low. • When cardiac output is near normal, then ETCO2 correlates with minute volume. • Only need to ventilate as often as a “load” of CO2 molecules are delivered to the lungs and exchanged for 02 molecules
EtCO2 Values • Normal 35 – 45 mmHg • Hypoventilation > 45 mmHg • Hyperventilation < 35 mmHg
Physiology • Relationship between CO2 and RR • RR CO2 Hyperventilation • RR CO2 Hypoventilation
Why ETCO2 I Have my Pulse Ox? Pulse Oximetry Capnography • Oxygen Saturation • Reflects Oxygenation • SpO2 changes lag when patient is hypoventilating or apneic • Should be used with Capnography • Carbon Dioxide • Reflects Ventilation • Hypoventilation/Apnea detected immediately • Should be used with pulse Oximetry
What does it really do for me? Non-Intubated Applications Intubated Applications • Bronchospasms: Asthma, COPD, Anaphlyaxis • Hypoventilation: Drugs, Stroke, CHF, Post-Ictal • Shock & Circulatory compromise • Hyperventilation Syndrome: Biofeedback • Verification of ETT placement • ETT surveillance during transport • Control ventilations during CHI and increased ICP • CPR: compression efficacy, early signs of ROSC, survival predictor
NORMAL CAPNOGRAM • Phase I is the beginning of exhalation • Phase I represents most of the anatomical dead space • Phase II is where the alveolar gas begins to mix with the dead space gas and the CO2 begins to rapidly rise • The anatomic dead space can be calculated using Phase I and II • Alveolar dead space can be calculated on the basis of : VD = VDanat + VDalv • Significant increase in the alveolar dead space signifies V/Q mismatch
NORMAL CAPNOGRAM • Phase III corresponds to the elimination of CO2 from the alveoli • Phase III usually has a slight increase in the slope as “slow” alveoli empty • The “slow” alveoli have a lower V/Q ratio and therefore have higher CO2 concentrations • In addition, diffusion of CO2 into the alveoli is greater during expiration. More pronounced in infants • ET CO2 is measured at the maximal point of Phase III. • Phase IV is the inspirational phase
ABNORMALITIES • Increased Phase III slope • Obstructive lung disease • Phase III dip • Spontaneous resp • Horizontal Phase III with large ET-art CO2 change • Pulmonary embolism • cardiac output • Hypovolemia • Sudden in ETCO2 to 0 • Dislodged tube • Vent malfunction • ET obstruction • Sudden in ETCO2 • Partial obstruction • Air leak • Exponential • Severe hyperventilation • Cardiopulmonary event
ABNORMALITIES • Gradual • Hyperventilation • Decreasing temp • Gradual in volume • Sudden increase in ETCO2 • Sodium bicarb administration • Release of limb tourniquet • Gradual increase • Fever • Hypoventilation • Increased baseline • Rebreathing • Exhausted CO2 absorber
PaCO2-PetCO2 gradient • Usually <6mm Hg • PetCO2 is usually less • Difference depends on the number of underperfused alveoli • Tend to mirror each other if the slope of Phase III is horizontal or has a minimal slope • Decreased cardiac output will increase the gradient • The gradient can be negative when healthy lungs are ventilated with high TV and low rate • Decreased FRC also gives a negative gradient by increasing the number of slow alveoli
LIMITATIONS • Critically ill patients often have rapidly changing dead space and V/Q mismatch • Higher rates and smaller TV can increase the amount of dead space ventilation • High mean airway pressures and PEEP restrict alveolar perfusion, leading to falsely decreased readings • Low cardiac output will decrease the reading
USES • Metabolic • Assess energy expenditure • Cardiovascular • Monitor trend in cardiac output • Can use as an indirect Fick method, but actual numbers are hard to quantify • Measure of effectiveness in CPR • Diagnosis of pulmonary embolism: measure gradient
PULMONARY USES • Effectiveness of therapy in bronchospasm • Monitor PaCO2-PetCO2 gradient • Worsening indicated by rising Phase III without plateau • Find optimal PEEP by following the gradient. Should be lowest at optimal PEEP. • Can predict successful extubation. • Dead space ratio to tidal volume ratio of >0.6 predicts failure. Normal is 0.33-0.45 • Limited usefulness in weaning the vent when patient is unstable from cardiovascular or pulmonary standpoint • Confirm ET tube placement
Normal Wave Form • Square box waveform • ETCO2 35-45 mm Hg • Management: Monitor Patient
Dislodged ETT • Loss of waveform • Loss of ETCO2 reading • Management: Replace ETT
Esophageal Intubation • Absence of waveform • Absence of ETCO2 • Management: Re-Intubate
CPR • Square box waveform • ETCO2 10-15 mm Hg (possibly higher) with adequate CPR • Management: Change Rescuers if ETCO2 falls below 10 mm Hg
Obstructive Airway • Shark fin waveform • With or without prolonged expiratory phase • Can be seen before actual attack • Indicative of Bronchospasm( asthma, COPD, allergic reaction)
ROSC (Return of Spontaneous Circulation) • During CPR sudden increase of ETCO2 above 10-15 mm Hg • Management: Check for pulse
Rising Baseline • Patient is re-breathing CO2 • Management: Check equipment for adequate oxygen flow • If patient is intubated allow more time to exhale
Hypoventilation • Prolonged waveform • ETCO2 >45 mm Hg • Management: Assist ventilations or intubate as needed
Hyperventilation • Shortened waveform • ETCO2 < 35 mm Hg • Management: If conscious gives biofeedback. If ventilating slow ventilations
Patient breathing around ETT • Angled, sloping down stroke on the waveform • In adults may mean ruptured cuff or tube too small • In pediatrics tube too small • Management: Assess patient, Oxygenate, ventilate and possible re-intubation
Curare cleft • Curare Cleft is when a neuromuscular blockade wears off • The patient takes small breaths that causes the cleft • Management: Consider neuromuscular blockade re-administration
CAPNOGRAM #1 J Int Care Med, 12(1): 18-32, 1997
CAPNOGRAM #2 J Int Care Med, 12(1): 18-32, 1997
CAPNOGRAM #3 J Int Care Med, 12(1): 18-32, 1997
CAPNOGRAM #4 J Int Care Med, 12(1): 18-32, 1997
CAPNOGRAM #5 J Int Care Med, 12(1): 18-32, 1997
CAPNOGRAM #6 J Int Care Med, 12(1): 18-32, 1997
CAPNOGRAM #7 J Int Care Med, 12(1): 18-32, 1997
CAPNOGRAM #8 J Int Care Med, 12(1): 18-32, 1997
Now what does all this mean to me? • ETCO2 is a great tool to help monitor the patients breath to breath status. • Can help recognize airway obstructions before the patient has signs of attacks • Helps you control the ETCO2 of head injuries • Can help to identify ROSC in cardiac arrest


![Respiratory Physiology [the Ins and Outs]](https://cdn2.slideserve.com/4330665/respiratory-physiology-the-ins-and-outs-dt.jpg)