Download
1 / 20
200 likes | 368 Vues
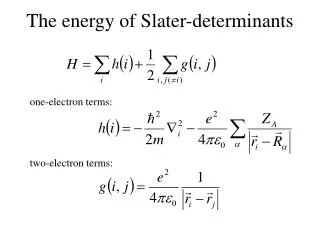
DIW BERLIN. International Trade with Solar Energy Technology Components Evidence on the Structure and Determinants?. 34th IAEE International Conference Wednesday June 22nd 2011 Session 63 Felix Groba German Institute of Economic Research Berlin

E N D
DIWBERLIN International Trade with Solar Energy Technology Components Evidence on the Structure and Determinants? 34th IAEE International Conference Wednesday June 22nd 2011 Session 63 Felix Groba German Institute of Economic Research Berlin Department of Energy, Transport and Environment Supported by Heinrich Böll Foundation
Motivation & Research Hypotheses (1) Figure 1. Development of Solar energy technology component exports by country group 1996-2008 and market structure 2008 Source: own calculations, Data retrieved from UN COMTRADE, WITS DATABASE • Trade not respected in description and analysis global market development. • Significant trade increase since 2001 (+600% since 1996). • OECD (EU) countries dominant exporting and importing markets. • Increasing importance of China and India. • Dominant trade directions North-North and South-North. • North-South and South-South trade remains limited.
Motivation & Research Hypotheses (2) What determines trade with solar energy technology components ? Is there evidence on the Porter hypothesis? What role do regulation and trade barriers in importing countries play in determining solar energy technology exports? H1: Stringent environmental regulation and renewable energy policy frameworks explain high exports of solar energy technologies. H2: A regulatory environment supportive of renewable energies increases imports of solar energy technology goods. 14-06-09 3
Table of Content I. Literature on Environmental Regulation and Trade II. Empirical Model and Estimation Method III. Data and Descriptive Statistics IV. Estimation Results V. Conclusion Backup
Literatur on Environmental Regulation and Trade • Research gap: • Detailed analysis of trade with renewable (solar) technology components. • Analysis of policy environment in importing countries. 5
Table of Content I. Literature on Environmental Regulation and Trade II. Empirical Model and Estimation Method III. Data and Descriptive Statistics IV. Estimation Results V. Conclusion Backup
Empirical Model and Estimation Method (1) Xijt = trade flow ß = coefficients Yijt = economic mass j Dij = distance (1) (2) FEGLS: • Inconsistent under error heterogeneity. • Inconsistent under persistent zero trade flows. (3) Poisson Pseudo Maximum Likelihood: • Provides consistent estimators (Santos Silva and Tenreyro 2006). • Respects zero trade flow. • Successfully implemented (e.g. McGee 2008, Siliverstovs 2009). • fixed effects on exporter and importer countries (di, dj) to account for multilateral trade resistance. 7
Empirical Specification • Balanced panel of bilateral export flows from 1999-2007. Estimated Model: • Solar technology exports (21 OECD countries 129 importing countries). • General trade controls. • Proxies of environmental regulation and renewable energy supportiveness. • Importing country policy proxies. • Fixed effect dummies and error component.
Table of Content I. Literature on Environmental Regulation and Trade II. Empirical Model and Estimation Method III. Data and Descriptive Statistics IV. Estimation Results V. Conclusion Backup
Data and Descriptive Statistics H1: Stringent environmental regulation and renewable energy policy frameworks explain high exports of solar energy technologies. Figure 2: Share of solar electricity generation from total electricity generation for selected OECD countries 1996 - 2007 • Output oriented measures: • Broad Environmental Regulation Index • Based on energy intensity and change in energy intensity. • van Beers & van den Bergh (1997) • Solar electricity share (+) • Proxy of demand and policy stringency. • Input oriented measures: • Per capita public R&D budget solar energy(+) • Policy stringency variable (Johnstone 2010). • Policy of renewable energy policies • Incentive tariffs, quotas, tax measures, voluntary agreements, tradable certificates. • Dummy for introduction. • Duration of policy. Figure 3: Public R&D expenditure for solar energy in US $ per capita for selected OECD countries 1996 -2007 14-06-09 10 Sources: IEA(2010), EIA (2011)
Data and Descriptive Statistics H2: A regulatory environment supportive of renewable energies increases imports of solar energy technology goods Figure 9: Global non-hydro renewable net electricity generation as share of total electricity generation 1996 - 2008 • Output oriented measures: • Broad Environmental Regulation Index (+) • Non-hydro renewable electricity share (+) • Proxy of demand and policy supportiveness. • Other Variables: • Effectivlyappliedtariffs on imports (-) • Proxy oftradecosts. Figure 10: Development of OECD solar energy exports and respective mean tariff applied by importing countries. 14-06-09 11 Sources: UNCTAD TRAINS (2010), EIA (2011)
Estimation Results General trade parameter (except GDP) Renewable energy support H 1 Policy Framework H 2 ( )
Findings & Conclusion • Highly dynamic market dominated by few counties. • Strict environmental regulation has not impact on export performance. • BUT: Countries with a strong renewable energy policies framwork export more solar energy technology components. • AND: countries that have introduced RE support policies early are exporting more. • Evidence on the Porter Hypothesis! • Policy framework and market size in importing countries decisive to determine export markets. • Stong environmental regulation decreases imports (general measure). • BUT: Strong demand for renewable energies increases imports. • Market size matters and Policy does matter! • Trade cost do not matter (depending on fixed effects). • Open Questions: • Respecting dynamics. • Identifying the role of innovation.
Thank You! Questions? Comments & Suggestions! Contact: Felix Groba DIW Berlin Mail: Mail: Fgroba@diw.de Tel: +49 30 89189681 ……..Backup
Questions to deal with (1) Fixed effects problematic (2) Dependent Variable (what to estimate) (3) Zero inflation of dependent variable zero trade flows present especially in the early years of the analysis (27.8%) How to implement in STATA (zip depvar [indepvars] [if] [in], ...) FE? and panel structure or cross section? Necessary? (4) Including other Policy control variables (Graph next slide) Policies introduced to foster RE expansion on national level BUT: may have and impact on trade performance Question: do I need to control for it or is it included in other controls already? If yes: Not the existence of the policy but the duration since implementation might isof interest
Backup 1 - Data basis global market analysis Databasis: UN COMTRADE Databank. 6-digit 1996 HS Codes Literature Review identifying PV, Solar Termal, Wind Technology Components Problems: Dual use, data inflation BUT: Best Proxy for cross time and cross country analysis Source: OECD/Eurostat [1999], Steenblik [2005a], Steenblick [2005b], Steenblick [2006], UNCTAD [2005], IPCC [2007]
I. Motivation II. Market Analysis Global Market Analysis – Country Specifics III. Panel i. Literatur X = Exports M = Imports i = Product Group j = Country Index ii. Variables iii. Method (1) (2) iii. Results • Results: • Germany is specialized in exporting but does not enjoy a comparative advantage because off high sector imports • China and India are increasing their market shares and also gain on specialization and competitive advantage
Empirical Model and Estimation Method (2) Potential effects: - Country specific time invariant - country specific time variant - Country pair specific time invariant - country specific time variant
Data and Descriptive Statistics H1b: Countries that are more innovative on renewable energies export more solar energy technologies Figure 5: Innovative activity in total patent applications and renewable energy patent application in OECD countries 1980 – 2007 (1996 = 100) • Innovations are relevant for trade [Krugman 1979] • Patents as indicator of innovation output • Very dynamic innovative activity in renewable energies Country share in total OECD patent applications (+) Figure 7: Country share in RE OECD patent applications 1990 - 2007 Country share in total OECD renewable energy patent applications (+) • Problem: • Data not solar energy technology specific 14-06-09 19 Sources: OECD(2010)
Backup 2 - Introduction of renewable energy policies Figure 4: Introduction of Renewable Energy Policies by country 1978 - 2010 Note: AT=Austria, AU=Australia, BE=Belgium, CA=Canada, CH=Switzerland, DE=Germany, DK=Denmark, ES=Spain, FI=Finland, FR=France, UK=United Kingdom, GR=Greece, IE=Ireland, IT=Italy, JP=Japan, KR=Republic of Korea, NL=Netherlands, NO=Norway, PT=Portugal, SE=Sweden, US=United States, Source: IEA (2004), authors extension