Download
1 / 8
80 likes | 198 Vues
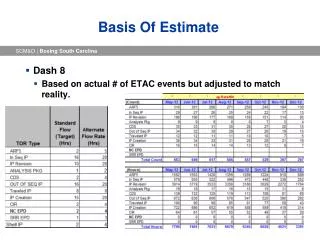
Basis of Scenario. Changing Shopping Patterns Evidence of a shift to shopping via out-of-state vendors Out-of-state taxable retail purchases have almost doubled in Missouri since 1993 Missouri average annual increase in out-of-state spending is 1.3 percent

E N D
Basis of Scenario Changing Shopping Patterns • Evidence of a shift to shopping via out-of-state vendors • Out-of-state taxable retail purchases have almost doubled in Missouri since 1993 • Missouri average annual increase in out-of-state spending is 1.3 percent • Has implications for Saline County retail sales and county government revenues
Baseline Retail Sales projection assumed a 2.2 percent annual growth rate • Using the average annual MO out-of-state purchases growth rate of 1.3%, the adjusted retail growth rate is 0.9 percent per year • This results in an annual loss of potential sales to local retailers of $22 million per year by 2007
County revenues assuming Missouri average out-of-state purchases is 4 percent less by 2007 than the projected baseline revenues.
Effects of a Local Use Tax • A local use tax would equalize the tax rate between taxable goods purchased out-of-state and locally. • A use tax would increase retail sales over the level projected by the adjusted baseline. • A use tax would increase county revenues over the level projected by the adjusted baseline.
Use Tax Revenue Potential Two Major Assumptions • This is for a point in time. The calculations do not consider the effect of growth (or decline) of out-of-state purchases with respect to total retail purchases. • Saline County follows the pattern observed in the other counties that have a local use tax.
Use Tax Revenue Potential-cont. Range 1: Use tax as a percent of total use and sales tax receipts was calculated for each county; the largest and smallest percent were used as limits to the range. Percent Use Tax Revenue Lower Limit: 6.5% $116,000 MO Average: 11.7% $222,000 Upper Limit: 15.2% $300,000
Use Tax Revenue Potential-cont. Range 2: Per capita retail sales was calculated. Data for the counties most similar to Saline County were used as limits to the range. Percent Use Tax Revenue Lower Limit: 8.5% $155,000 Upper Limit: 11.4% $215,000
Summary • Changing shopping patterns have local consequences - declining growth in retail sales and county revenues. • A use tax may offset some of the slower growth in local retail sales and county revenues caused by shopping out-of-state. • If the assumptions hold, county revenues could increase annually by $100,000 or more.