Download
1 / 36
360 likes | 462 Vues
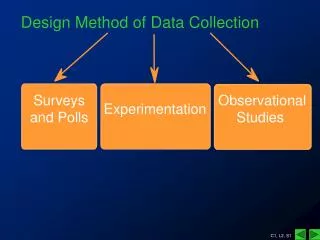
The Role of Institutional Research and Data Collection in an Organizational Design Process. Speakers: Bill Neal, Assistant to the President Susan Barton, Professor of Mathematics. Overview. Introduction to BYU-Hawaii Charge to New President The Organizational Design Team (ODT)

E N D
The Role of Institutional Research and Data Collection in an Organizational Design Process Speakers: Bill Neal, Assistant to the President Susan Barton, Professor of Mathematics
Overview • Introduction to BYU-Hawaii • Charge to New President • The Organizational Design Team (ODT) • Guiding Principles • General Methodology • Data Gathering Process • Sample of “Deliverables” • IR Challenges • Conclusion
Introduction to BYU-Hawaii • An accredited four-year undergraduate institution with 2,400 students from more than 70 countries • Founded and operated by The Church of Jesus Christ of Latter-day Saints • Assists individuals in their quest to influence the establishment of peace internationally
Key Indicators 2007 • FTE Student per FTE Faculty: 17.2 • FTE Student per FTE Admin: 35.4 • FTE Student per FTE Staff: 26.0 • Cost per Student: $16,303 • Church Funded Operations: 81.8% • Tuition Discounts: 41.2% • Placement: 56.5% (U.S. avg.:45%)
Charge to New President • Continue to improve quality of the broad educational experience for students • Lower the Cost of the student’s education to the Church (Cost per FTE student) • Serve more students
Organizational Design Team • Members with diverse backgrounds • Assistant to the President (Institutional Research) • Dean, School of Computing • Director, Student Activities & Leadership • Dean Admissions & Records • Professor of Mathematics • Budget Officer
Design Team’s Assignment • Assess the current organizational structure • Align organization and its core processes for dramatic • improvement in the student’s educational experience • (outside the classroom) • Align the structure and processes to our mission and board’s charter • Organize toward more cost efficient operations
Premise: Organizations are perfectly designed to get the results they get. Get picture from Steve !!
Guiding Principles • Student focused • Focus on activities/tasks not departments • Similar activities consolidated • Fewer directors with more responsibilities • Identify one “owner” for each major process • Presumes right personnel and working processes (with accountability) • Well-functioning councils (committees) • Focus not on teaching or faculty but on operations
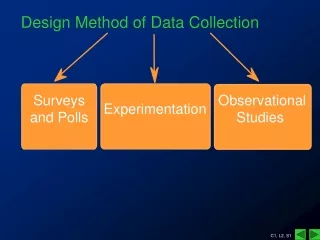
Initial Data Collection • Current organizational structure and chart • Department activities and responsibilities • Discussion document from departments • Products and services • Whom they serve • Ideas for improvement
Initial Data Collection • Department activities and responsibilities (cont.) • Follow up Interviews with campus departments to clarify: • How department is organized? • What is your department doing that should be done by another department to be more cost effective? • What is another department doing that your department should do for more efficiency? • What are some improvements that can be made in your department and other departments?
Obtaining and Utilizing Feedback • Several focus groups held with the students, faculty and staff • University wide meetings held periodically • Email account created and “workspace” for communication purposes and obtaining feedback • Benchmarks solicited from departments • Benchmarks or comparisons that departments use to gage success • Solicited assistance from department leaders in obtaining benchmark metrics from national organizations
(ODT webpage information goes here. Johnson is working on it???) • Questions??
Institutional Research Related Data • 20 Comparison Schools of similar size, location or mission (e.g. Eckerd College, Chaminade, BYU-Provo) • Benchmarking data on organizational structure • Department responsibilities • Department sizes and proportion to campus populations • Staffing details for 25 departments • Student/FTE Staff Ratio • Student/FTE Faculty Ratio • Professional organization survey results and size recommendations
Put slide here with a snap shot of the comparison schools dept data • Ceci—can you do this????
Sampling of Deliverables • Core Processes • Core Process Detailed Definition • Organizational Chart • Recommended realignment of departments and management structure • Major Tasks and Key Factors for Success • Leadership Roles and Guidelines • Councils Document • Sizing Recommendations
Selection/ Preparation “Successful Graduates Spiritual/Discipleship Academics Student Development Work/Career Preparation Enabling Processes
Reorganized the President’s Council • Three major divisions: Academics, Student Support and University Support • VP for Academics, VP for Student Support, VP for University Support (Services), and Assistant to the President • Major activities/tasks assigned and “ownership” given to President, each VP, and Assistant to the President
Key Indicators 2008 (2007) • FTE Student per FTE Faculty: 18.1 (17.2) • FTE Student per FTE Admin: 36.6 (35.4) • FTE Student per FTE Staff: 26.9 (26.0) • Cost per Student: $14,959 ($16,303) • Church Funded Operations: 78.9% (81.8%) • Tuition Discounts: 32.5% (41.2%) • Placement: 62.7% (56.5%)
IR Challenges • National benchmarking data unavailable • Inconsistent organizational structures and position titles makes search difficult • Most schools do not include staffing details either on IPEDS or their web site
Conclusion • (How the project impacted our University) • So Bill and Steve what have you noticed? • I have been down in the trenches and have not noticed much difference related to the ODT recommendations– what I have noticed did not come from the ODT even though we often get blamed for it. e.g. hiring freeze – that came from SLC, freeze on building—that came from our friendly neighborhood planning commission. Etc.
How Charge was Addressed • Continue to improve quality of the broad educational experience for students • The role of operations • Organized to improve potential for smooth operations (with accountability) • Councils to improve communication
How Charge was Addressed • Lower the cost of the student’s education to the Church (Cost per FTE student) • More efficient operations • Fewer directors with more responsibilities • Fewer employees where possible • Serve more students • More streamlined operations • “Recruitment to Placement” focus • Councils to improve communication
Premise: Organizations are perfectly designed to get the results they get. Key Questions: • What are the desired Results? • What are the gaps between the desired results and current results? • How should the University be organized?
BYU-Hawaii’s uniqueness is in developing converted, educated, productive leaders and peacemakers throughout the world; especially in Asia and the Pacific.