Download
1 / 21
220 likes | 335 Vues
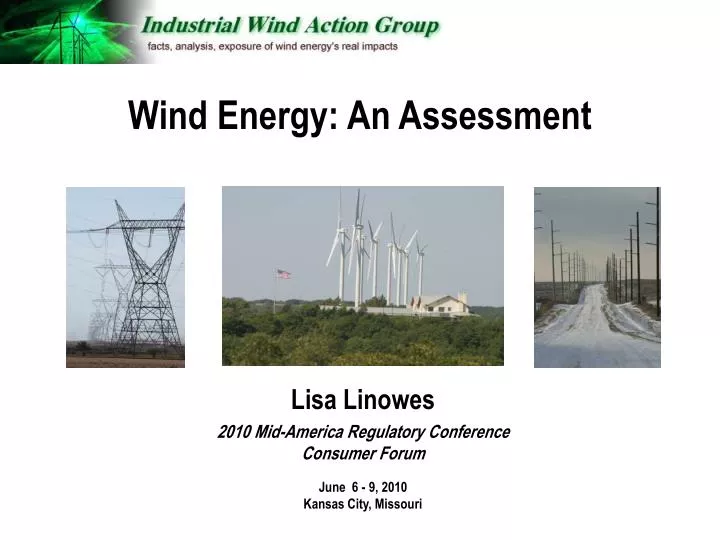
Wind Energy: An Assessment. Lisa Linowes 2010 Mid-America Regulatory Conference Consumer Forum June 6 - 9, 2010 Kansas City, Missouri. Energy market goals. Meeting peak demand energy needs Efficient, reliable, cost-effective generation Greenhouse emission reductions

E N D
Wind Energy: An Assessment Lisa Linowes 2010 Mid-America Regulatory Conference Consumer Forum June 6 - 9, 2010Kansas City, Missouri
Energy market goals Meeting peak demand energy needs Efficient, reliable, cost-effective generation Greenhouse emission reductions Stable, secure, sustained fuel sources (nix foreign oil) Environmentally sensitive siting of generation June 9, 2010 2
The System Planning Joint Coordinated System Plan Eastern Interconnection Planning Collaborative June 9, 2010 3
The Tools State Renewable Portfolio Standard State requires a % of electric energy sales be generated by renewable technologies (29 states and DC mandatory) Federal Production Tax Credit (since 1992) Per KWh tax credit for electricity generated by qualified resources Stimulus Bill: Federal loan guarantees US Department of Energy guaranteed loans to finance renewable energy projects, electric transmission projects, etc. No performance requirement. June 9, 2010 4
Where is this “policy” headed? June 9, 2010 5
Industrial wind represents more than 90% of the proposed generating capacity of all renewable energy projects. Image: Elk River 150mw facility, Butler County Kansas June 9, 2010 6
The Vision June 9, 2010 7
... And what this would look like. • 305,000 MW of installed wind geographically distributed • 19,000 miles of new 765 kV transmission lines • $60+ billion in transmission & infrastructure costs(2007 dollars, assumes $2.6 million per mile 765 kV line cost) • Wind power development capital costs in the trillions • Profit motive married to fast-tracking of approvals Fine print: costs are ballpark estimates created without the benefit of detailed engineering. Sources: American Electric Power: Interstate Transmission Vision for Wind Integration (2007)DOE 20% wind power by 2030 (2008) June 9, 2010 8
Compared to today • US Total installed: 34,000 mw June 9, 2010 9
Crash course in wind • Energy resource with limited capacity value • Intermittent, non-dispatchable, unpredictableProduction ‘out of sync’ with load (and peak) • Locationally constrained, land intensive • May displace fossil fuel but cannot replace it • Runs counter to Standard Market Design principles • Environmental/societal costs not well understood • Free, but very expensive! High contract price; costs spread over fewer hours of generation. June 9, 2010 10
What DOE says about wind • Wind is an energy resource, not a capacity resource. • The capacity value of wind has been shown to range from approximately 5% to 40% of rated capacity. • Because wind is not a capacity resource, it does not require 100% backup when the wind is not blowing. • Wind power cannot replace the need for many “capacity resources” …If wind has some capacity value for reliability planning purposes, that should be viewed as a bonus, but not a necessity. Source: June 2008 DOE report “20 percent wind power by 2030” June 9, 2010 11
Stetson wind April 8, 2009 June 9, 2010 12
Stetson wind April 25, 2009 June 9, 2010 13
Stetson wind May 31, 2009 June 9, 2010 14
Benton County Wind (130.5 mw) Hourly Gen… …mapped to PJM Hourly Load Capacity Factor MWH Period from July 14, 2008 to July 18, 2008 http://www.pjm.org/markets-and-operations/energy/real-time/loadhryr.aspx http://www.ferc.gov/docs-filing/eqr/data/spreadsheet.asp June 9, 2010 15
Benton County Wind (130.5 mw) Hourly Gen… …mapped to PJM Hourly Load Capacity Factor MWH http://www.pjm.org/markets-and-operations/energy/real-time/loadhryr.aspx http://www.ferc.gov/docs-filing/eqr/data/spreadsheet.asp June 9, 2010 16
RPS & the REC market • Twenty-nine states plus DC • Establish set-aside market for renewables(Qualified renewables vary by State and subject are to change) • Single-price system rewards energy not capacity • Discourages competition leading to higher prices (Economic development) • Arbitrary percentages, limited analysis (ex: IL) June 9, 2010 17
Valuing a REC • A single metric: 1 MWh of energy equals 1 REC • Based on a single assumption: 1 MWh of renewable energybacks out 1 MWh fossil June 9, 2010 18
RECs, a binary market • As compliance is met, REC prices sink • Ex: • MA alternative compliance payment: $61/MWh • Current market value for same: $18/MWh • Future REC values: under $25 through to 2016 Source: Chicago Climate Futures Exchange June 9, 2010 19
Case study: Cape Wind • 130 turbines, 468 mw installed (3.6 mw each) • Anticipated average CF: 39% (~182 mw) • Terms of negotiated PPA just released: - Wholesale, bundle energy price: $207 MWh - REC component: $67 MWh - Energy component: $140 MWh - 3.5% yearly escalator Comparable renewables pricing: $80 MWh Conventional pricing: $50 MWh or less June 9, 2010 20
Thank You Lisa Linowes www.windaction.org 603-838-6588