Download
1 / 45
450 likes | 522 Vues
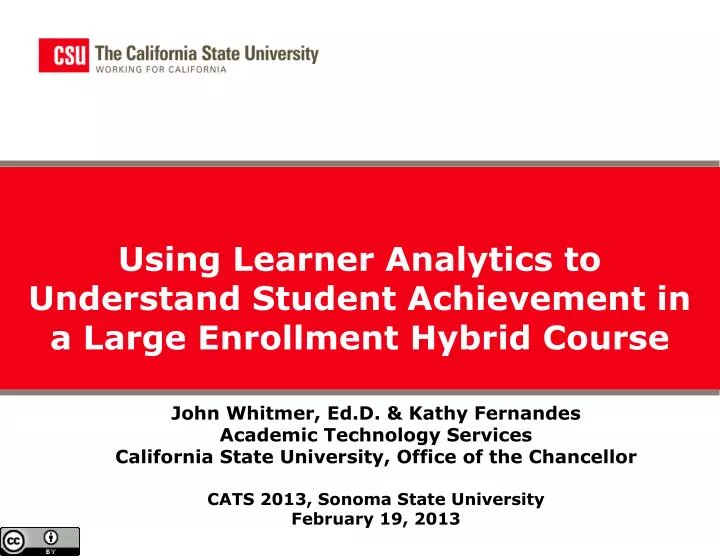
Using Learner Analytics to Understand Student Achievement in a Large Enrollment Hybrid Course. John Whitmer, Ed.D. & Kathy Fernandes Academic Technology Services California State University, Office of the Chancellor CATS 2013, Sonoma State University February 19, 2013. Outline. Context

E N D
Using Learner Analytics to Understand Student Achievement in a Large Enrollment Hybrid Course John Whitmer, Ed.D. & Kathy FernandesAcademic Technology Services California State University, Office of the Chancellor CATS 2013, Sonoma State University February 19, 2013
Outline • Context • Learning Analytics, Methods & Tools • Findings • Conclusions & Next Steps • Becoming a Data Scientist (pending time & interest)
Why are you here? • To increase my knowledge of “Learning Analytics” • To get ideas about how I can become a “Data Scientist” (or practice analytics) • To learn about the results of this study • Because this was the closest room
Case Study: Intro to Religious Studies • Undergraduate, introductory, high demand • Redesigned to hybrid delivery format through “academy eLearning program” • Enrollment: 373 students (54% increase on largest section) • Highest LMS (Vista) usage entire campus Fall 2010 (>250k hits) • Bimodal outcomes: • 10% increase on final exam • 7% & 11% increase in DWF • Why? Can’t tell with aggregated data 54 F’s
Guiding Questions • How is student LMS use related to academic achievement in a single course section? • How does that finding compare to the relationship of achievement with traditional student characteristic variables? • How are these relationships different for “at-risk” students (URM & Pell-eligible)? • What data sources, variables and methods are most useful to answer these questions?
It takes a village … • Chico “Graduation Initiative” endorsement • Former CIO (Bill Post included in project portfolio) • Registrar approval • Active participation: • Kathy Fernandes, Director Academic Technology • William A. Allen, Director of Institutional Research • Scott Kodai, Manager Distributed Learning Technologies and Classroom Services
Predict the trend: Grade w/Mean LMS Hits What will the trend look like?
Learner Analytics “ ... measurement, collection, analysis and reporting of data about learners and their contexts, for purposes of understanding and optimizing learning and the environments in which it occurs.” (Siemens, 2011)
How? Knowledge & Skills Involved http://www.drewconway.com/zia/?p=2378
Data Extracts & Sources • LMS Data • SQL queries on WebCT Vista web server log file • Student Data • Query against Peoplesoft data • ERSS data elements (common to CSU) • Required Institutional Research • Course Data • Query against Peoplesoft data
Methods at a Glance • Clean/filter/transform/reduce data (70% effort) • Descriptive / exploratory analysis (20% effort) • Statistical analysis (10% effort) • Factor analysis • Correlation single variables • Regression multiple variables; partial & complete
Correlation: Student Char. w/Final Grade Scatterplot of HS GPA vs. Course Grade
LMS Use Variables Student Characteristic Variables Enrollment Status First in Family to Attend College Gender HS GPA Major-College Pell Eligible URM and Pell-Eligibility Interaction Under-Represented Minority URM and Gender Interaction • Administrative Activities (calendar, announcements) • Assessment Activities (quiz, homework, assignments, grade center) • Content Activities(web hits, PDF, content pages) • Engagement Activities (discussion, mail)
Predict the trend • LMS use and final grade is _______ compared to student characteristics and final grade: • 50% smaller • 25% smaller • the same • 200% larger • 400% larger
Predict the trend • LMS use and final grade is _______ compared to student characteristics and final grade: • 50% smaller • 25% smaller • the same • 200% larger • 400% larger
Correlation LMS Use w/Final Grade Scatterplot of Assessment Activity Hits vs. Course Grade
Conclusion: LMS Use Variables better Predictors than Student Characteristics LMS Use Variables18% Average(r = 0.35–0.48)Explanation of change in final grade Student Characteristic Variables 4% Average(r = -0.11–0.31) Explanation of change in final grade >
SmallestLMS Use Variable(Administrative Activities) r = 0.35 Largest Student Characteristic (HS GPA) r = 0.31 >
Combined Variables Regression Final Grade by LMS Use & Student Characteristic Variables LMS Use Variables25% (r2=0.25)Explanation of change in final grade Student Characteristic Variables +10%(r2=0.35) Explanation of change in final grade >
Predict the trend • LMS use and final grade is ______ for “at-risk”* students? • 50% smaller than not at-risk students • 20% smaller than not at-risk students • No difference than not at-risk students • 20% larger than not at-risk students • 100% larger than not at-risk students *at-risk = BOTH under-represented minority and Pell-eligible
Predict the trend • LMS use and final grade is ______ for “at-risk”* students? • 50% smaller than not at-risk students • 20% smaller than not at-risk students • No difference than not at-risk students • 20% larger than not at-risk students • 100% larger than not at-risk students *at-risk = BOTH under-represented minority and Pell-eligible
Question 3 Results:Regressionby “At Risk” Population Subsamples
Activities by Pell and Grade Extra effort in content-related activities
Conclusions • At the course level, LMS use better predictor of academic achievement than student demographics (what do, not who are). • Small strength magnitude of complete model demonstrates relevance of data, but suggests that better methods could produce stronger results. • LMS data requires extensive filtering to be useful; student variables need pre-screening for missing data.
More Conclusions • LMS use frequency is a proxy for effort. Not a very complex indicator. • Student demographic measures need revision for utility in Postmodern era (importance to student, more frequent sampling, etc.). • LMS effectiveness for at-risk students may be caused by non-technical barriers. Need additional research!
CSU Learner Analytics Collaborative Projects Moodle: mCURL (Moodle Common Use Reporting & Learning Analytics) • 8 CSU & 2 UC Campuses • Building common SQL queries for accurate & comparative use metrics • 2 rounds of data collection already completed and discussed Blackboard: Analytics for Learn Pilot • 3 CSU Campuses • Bb Learn Analytics product available “off the shelf”; defined and integrated with Peoplesoft • Building common queries & campus-specific reporting
Choose your domain(s) http://www.drewconway.com/zia/?p=2378
Potential Resources • Math/Stats: campus classes • MOOC resources (search “Data”, “Statistics”, or “Analytics”) • Society for Learning Analytics Research (http://www.solaresearch.org/) • Learning Analytics Resources (http://johnwhitmer.net/resources/)
Feedback? Questions? Kathy Fernandes kfernandes@csuchico.edu John Whitmer jwhitmer@calstate.edu Complete monographhttp://bit.ly/15ijySP Twitter: johncwhitmer
LMS Use Consistent across Categories Factor Analysis of LMS Use Categories
Ideas & Feedback Potential for improved LMS analysis methods: • time series analysis • social learning • activity patterns • discourse content analysis Group students by broader identity, with unique variables: • Continuing student (Current college GPA, URM, etc. • First-time freshman (HS GPA, SAT/Act, etc)