Download
1 / 28
280 likes | 364 Vues
Buses in Tourist Areas Toolkit and Findings. Dr Jo Guiver Institute of Transport and Tourism. Background. Tourism on Board 2005, 2006 Local Customised Surveys since. Tourism on Board 2005. Tourism on Board 2005. Tourism on Board 2006. Tourism on Board 2005. Customised survey 2007-2009.

E N D
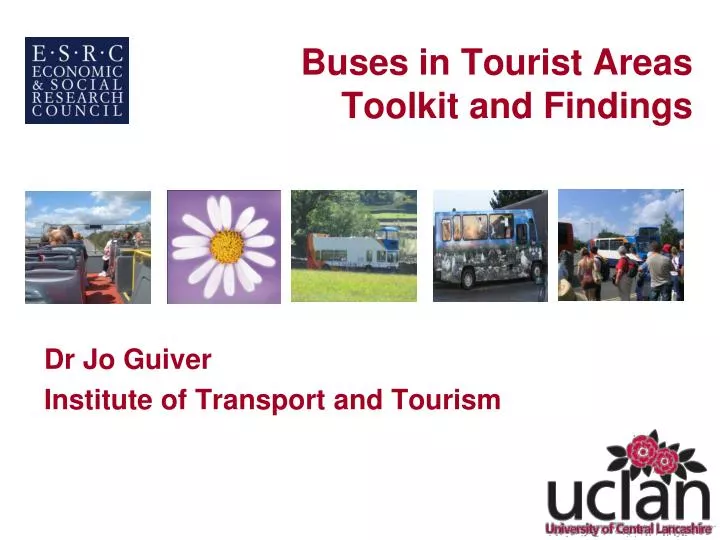
Buses in Tourist AreasToolkit and Findings Dr Jo Guiver Institute of Transport and Tourism
Background • Tourism on Board 2005, 2006 • Local Customised Surveys since
Tourism on Board 2005 Tourism on Board 2006
Tourism on Board 2005 Customised survey 2007-2009 Forest of Bowland Tourism on Board 2006
Tourism on Board 2005 Northumbria Coast Customised survey 2007-2009 Forest of Bowland Three Rivers, Hants Durlston Tourism on Board 2006 ESRC Project 2010
Rationale • Minimise effort (ITT and managers) • Maximise effect • Evidence, comparison, diagnosis, • Systematise and make comparable results • Eventually create benchmarks
Findings: Passengers 662 respondents • 44% Male, 56% Female
Findings: Passengers 662 respondents • 44% Male, 56% Female • Older profile
Findings: Passengers 662 respondents • 44% Male, 56% Female • Older profile • Lower income groups • 11% with disability which restricts mobility • 58% no car available on day • 7% (44) from overseas
Satisfaction • 89% would recommend service to a friend • 64% had a great time • Most Factors ‘very good’ • Comfort, Information and Frequency ‘good’
Physical Activity • 88% of respondents did some form of physical activity • 418 (63%) people walked • 14 (2%) people cycled • 115 (17%) said they did other physical activity
Alternatives • 35% would stay at home • 63% would not visit area • (Stay at home 35% + Different destination 28%) • 26% would use a car • 22% to same destination, • 4% to different destination • 48% would change day of travel to use bus
Spending • Average Spending per day • £16.74 excluding accommodation • £24.37 with accommodation for one night • 33% stayed at least one night in holiday accommodation • 153 of these had paid for their accommodation at an average rate of £32.99 per person per night. • Average length of stay was 6 nights
In Summary • We have evidence that these buses are helping to: • Improve health and well-being • Reduce Social Exclusion • Reduce car use • Generate Local spending
Where to now? • Enlarge data collection? • Extrapolate survey findings to whole season? • Look at costs? • More investigation into what works/what doesn’t?