Download
1 / 43
430 likes | 690 Vues
Media Workshop Role of Trade in Poverty Reduction Nagarkot, 1 – 2 December 2006. Concepts and Tools for Analyzing the Linkage between Trade and Poverty Bishwa Nath Tiwari Associate Professor, T.U. Objectives. Introduce the concepts of poverty and inequality

E N D
Media WorkshopRole of Trade in Poverty ReductionNagarkot,1 – 2 December 2006 Concepts and Tools for Analyzing the Linkage between Trade and Poverty Bishwa Nath Tiwari Associate Professor, T.U.
Objectives • Introduce the concepts of poverty and inequality • Introduce some trade related concepts • Analyze the effect of trade on poverty
PART I CONCEPT OF POVERTY
Concept of Poverty • Deprivation from the means of well-being • Multi dimensional • Earlier income was the only dimension – Income Poverty • Now poverty has many dimensions – income, human/social, exclusion and voiceless ness
Income Poverty Measures • GNP per capita (US $ 1 per capita/day)– international comparison • National Poverty Line
Comparing GNP across Countries • Comparison of GNP from one country to another may be distorted by movements in exchange rates. • Converting all goods and services to US$ tends to understate income of LDCs • Measuring national income at purchasing power parity (PPP) can help to overcome this problem.
Per Capita Income in Nepal GNP per capita US$ 260 in 2004 GNP per capita PPP US$ 1,470 in 2004 This simply implies that the goods and services in Nepal are cheaper by 5.65 folds.
What is PPP Purchasing power parity is the exchange rate at which the goods in one country cost the same as goods in another country.
Purchasing Power Parity • PPP states that the exchange rate between two countries’ currency equals to the two countries’ price level. Where: Pus = Price level of USA Puk = Price level of UK e = Exchange rate
Interpretation of Equations of PPP • The left side of the equation is $ price of commodity basket in US; the right side is the $ price of the basket when purchased in UK. These two prices are same if PPP holds (Eq 1). • PPP asserts that all countries’ price level are equal when measured in terms of the same currency. • PPP holds when, at going exchange rates, every currency’s domestic purchasing power is always the same as its foreign purchasing power.
National Poverty Measures National Poverty Line (Rs. 5,089 per capita/year at 1995-96 price)
National Poverty Measures The most commonly used poverty measures are: • Head Count Index • Poverty Gap • Proportional Poverty Gap • Squared Poverty Gap
Head Count Index • HCI = (# poor) / (population) • Measures the “incidence” of poverty • i.e. it tells us “How many poor”
Head Count Index • Simplest and most commonly used measure • Limitations: • Does not account for depth of poverty; i.e. it does not tell us how far below the poverty line the poor are • Advantages: • Simple to understand, straightforward interpretation • Additive across populations
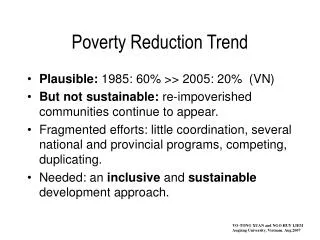
Poverty Incidence: 1995-96 & 2003-04 • It was 41.8% in 1995-96 • It decreased to 31.8% in 2003-04 • However, inequality increased from 0.34 to 0.41 • Poverty would have reduced further had there NOT been increase in income inequality
Some Questions • By how much poverty incidence has decreased from 1995-96 to 2003-04? • What is the difference between percentage points and percent?
Inequality Measures • Common measures of inequality • Distribution of income by Decile or Quintile • Gini Coefficient • most commonly used summary statistic for inequality
Gini Coefficient 100 Lorenz Curve Cumulative Income Share 0 100 Cumulative Population Share (poorest to riches)
Gini Coefficient 100 Lorenz Curve 1 Lorenz Curve 2 Cumulative Income Share 0 100 Cumulative Population Share
Gini Coefficient 100 Lorenz Curve Cumulative Income Share Gini = A / A + B A B 0 100 Cumulative Population Share
Gini Coefficient • Gini varies from 0 – 1 • Gini coefficient of Nepal increases from 0.34 to 0.41 during 1995-96 and 2003-04 • Higher Ginis represent higher inequality • The Gini is only a summary statistic, it doesn’t tell us what is happening over the whole distribution
PART II TRADE
Tools of International Economics • Tariff • Non-tariff – Import quota • Effective rate of protection • Export Subsidy • Consumer and producer surplus • Terms of Trade • Edge worth Diagram
Consumer Loss = a + b + c + d Price Producer Gain = a Govt Revenue = c Pt a b c d Pw Cost and Benefits of Trade: A Case of Small Country d s Quantity
Terms of Trade (TOT) • TOT is the ratio of the price of an export commodity/-ies to the price of an import commodity/-ies. • At the country level, it is Index of price of a country’s export in terms of its import • TOT are sometimes used as a proxy for the relative social welfare of a country, but this should be used with extreme caution. • An improvement in a nation's TOT is good for a country in the sense that it has to pay less for the products it imports.
Further Application of TOT • It can be applied within country - between two sectors (agriculture vs Industry) - between commodities (tobacco vs milk)
Effective Rate of Protection (ERP) A measure of the protection provided to an industry or in a country by the entire tariff structure, including the effects of tariff on outputs and inputs. • This equals (VAd/VAint) - 1, where: • VAd = domestic value added • VAint = international value added
Effective Rate of Protection Example ERP =(VAd – VAw)/VAw The initial ERP is 100 * (15 - 5)/5 = 200%. The new ERP is 100 * (10.25 - 5)/5 = 105%.
ERP If the total value of the tariffs on importable inputs exceeds that on the outputs, the effective rate of protection is negative
PART III EFFECT OF TRADE ON POVERTY
Two pillars of Poverty Reduction Strategy • Creation of good investment climate to propel growth, and • Empowerment of poor people to enable them to take part in that growth Trade reform is a key part of the first pillar
Rationale for Trade Reform • Trade liberalization enhances growth • Growth reduces poverty • Trade openness – raises allocative efficiency and income; and increases productivity
Trade liberalization • Trade policy liberalization includes efforts to reduce the level of protection against foreign goods and services • There are free trade areas, custom unions and free economic areas
Trade & Poverty: Transmission Channels • Trade policies have an impact on household welfare through the changes they induce in prices of goods, factors, and in government revenue. • In short run, if a household can not modify their production and consumption decisions, trade liberalization will not necessarily reduce poverty. • There are three channels: prices, labor markets, and government revenues and spending
Trade Policy Price of Goods & Services Price of Factors of Production Government Revenue & Expdt Individual & Households
Price Channel • Trade policies affect the relative prices of the goods consumed and produced by households, and thus affect the household welfare and poverty. • Once the good is inside a country, its price is influenced by internal factors such as trade costs, institutions, and local competition. These factors soften/amplify the effects trade policies have on households.
Labor Market Channel • With trade liberalization, labor earnings can increase. In effect, the impact is ambiguous.
Government Revenues and Public Spending • As trade policy influences trade tax revenues, either compensatory taxes should be levied or government expenditure in the form of public goods and public transfers should be reduced. • Price and labor market channels are more important.
Impact of trade Liberalization on Poverty • Positive impact on poverty (cline, 2004 and Winters, 2006) • Have worsened inequality in majority of cases (Cornia, 2004) • Some people are positively and some are negatively affected (Ravallion, 2004)