Download
1 / 8
80 likes | 224 Vues
Labor Force Participation. Here we look at some definitions about the labor force from a measurement point of view. For purposes of measuring employment concepts a person can only be in one of these categories:. People under 16 or in an institution. People not wanting to work. People working.

E N D
Labor Force Participation Here we look at some definitions about the labor force from a measurement point of view.
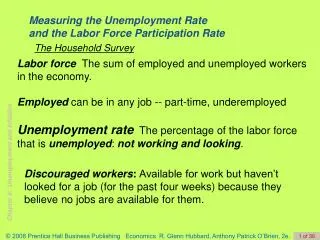
For purposes of measuring employment concepts a person can only be in one of these categories: People under 16 or in an institution People not wanting to work People working People not working but looking to work A B E U I have called each block by a letter. Population = P = A + B + E + U, Labor force = LF = E + U, Unemployment rate = U/LF, Labor force participation rate = LF/(P-A). So, the labor force is made up of those folks working or looking to work. The unemployment rate is % of labor force unemployed, while the participation rate looks at labor force as a % of the population.
Example: A = 22, B = 23, E = 50, U = 5. Unemployment rate = 5/55 = .091, Labor force = 55. Labor force participation rate = 55/(100-22) = .71 Discouraged Worker A discouraged worker is one who has been looking for work, but eventually quits looking for work because they can not find a job. The discouraged worker moves from the U group to the B group and is no longer counted in the unemployment statistics. From our example if 2 of the U group moves to the B group then the unemployment rate becomes 3/53 = .057.
Hidden unemployment From the previous screen we see with the discouraged workers the unemployment rate is 5.7%. These folks have given up, but really wanted to work. If they were counted the rate would be 9.1%. The discouraged worker is considered to be hidden unemployment and because of this we know the measured unemployment rate is too low. How much low is hard to tell. Next let’s look at some graphs of labor force participation I created in Excel from data the author had in the book.
The participation rate of all men is the third line down from the top and we see it is drifting downward. The participation rate among men 65 and over is really declining!
Note the participation rate for women is on the increase. This is especially true for women once married but not now due to death, divorce or separation.
Note the convergence of the participation rates of men and women.
Here we have seen some graphs about labor force participation rates. These graphs give a view of the folks wanting to work. Next let’s turn to a model about why people want to work. More formally, we turn to the labor supply model called the neoclassical model of labor-leisure choice.