Download
1 / 36
450 likes | 665 Vues
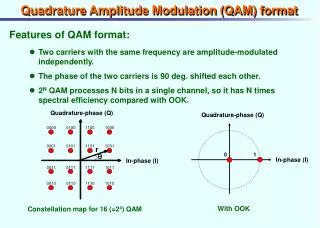
QAM Technology. Rev. A00. CATV HFC Network. HDTV, MOD, VoIP, and Broadband data services are made possible by digital cable services. Analog vs. Digital. Analog. Digital. Haystack. Video. Audio. Video and audio channels are modulated to three separated frequencies within a 6MHz bandwidth

E N D
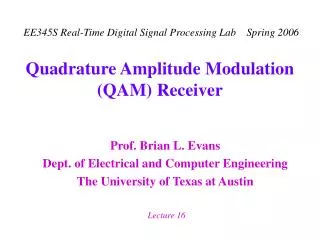
QAM Technology Rev. A00
CATV HFC Network HDTV, MOD, VoIP, and Broadband data services are made possible by digital cable services. Confidential & Proprietary Information of VeEX Inc.
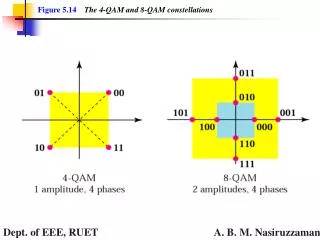
Analog vs. Digital Analog Digital Haystack Video Audio • Video and audio channels are modulated to three separated frequencies within a 6MHz bandwidth • They are transmitted at different levels. Normally, a video channel is about 10dB higher than the Audio channels • Signals are Analog in nature, and therefore, more resistant to noise • Video and audio signals are digitized to Digital 0 and 1, QPSK or QAM modulated, then transmitted in a 6MHz band. • Digital symbols (bits) embedded in the Haystack • High Digital bit rates can be transmitted in a 6MHz band for up to 40Mbps suitable for Internet, VoIP, or HDTV services • Noise can affect the Digital bit streams • Uses Forward Error Correction (FEC) to correct errors caused by noise Confidential & Proprietary Information of VeEX Inc.
Effect of noise on Analog systems (gradually poorer C/N) 45dB C/N 35dB C/N 25dB C/N 20dB C/N Effect of noise on Digital systems (gradually poorer MER) 25dB MER 18dB MER 17dB MER 16dB MER Digital TV vs. Analog TV Noise has very little affect on Digital systems until the system fails completely. Confidential & Proprietary Information of VeEX Inc.
QAM Constellation Diagram Quadrant 4 Quadrant 1 Quadrant 3 Quadrant 2 Confidential & Proprietary Information of VeEX Inc.
HFC Forward Path QAM64 or QAM256 are commonly used Confidential & Proprietary Information of VeEX Inc.
HFC Return Path DOCSIS Data-Over-Cable Service Interface Specifications (DOCSIS) Reverse Path/Upstream Data Rate Standard symbol rate (bandwidth): 1.28 (1.6), 2.56 (3.2), 5.12 (6.4)MHz Confidential & Proprietary Information of VeEX Inc.
Measuring Analog Channels Confidential & Proprietary Information of VeEX Inc.
Measuring Digital Channels Easy? • Signal Level, MER • Checks for Pre and Post FEC errors = 0 Confidential & Proprietary Information of VeEX Inc.
Tiling What is the Problem? • What does the signal level meter and spectrum analyzer tell us about the digitally modulated signal on Channel 93 (639MHz)? • The average power level is +4.6 dBmV • The “Haystack” looks OK • Hmmm, must be the STB! Confidential & Proprietary Information of VeEX Inc.
What’s Missing? • While a signal level meter and conventional spectrum analyzer are valuable tools, they do not tell the whole story about the health of downstream and upstream digitally modulated signals • How, then, can one “look inside” the Haystack to see what’s going on? ? Confidential & Proprietary Information of VeEX Inc.
QAM Analyzer • QAM Analyzers support a suite of sophisticated measurements • Analog channel signal level • Digital channel average power • Constellation display • Modulation error ratio (MER) • Pre- and post-FEC bit error rate • Adaptive equalizer graph • Some instruments with DOCSIS Cable Modem can measure the upstream channels of their: • Upstream transmit level • IP Ping • Trace Route • Web browser • Throughput • VoIP, IPTV • Some instruments support other measurements such as: • In-channel frequency response, group delay • Ingress or interference under the carrier • Phase jitter • Max amplitude change • HUM • EVM • More advanced instruments support additional measurements such as: • Symbol rate error • Frequency error • Un-equalized MER • Echo margin • Noise margin • Equalizer stress • ASI MPEG • MPEG analysis Confidential & Proprietary Information of VeEX Inc.
QAM Analyzer Block Diagram ASI Confidential & Proprietary Information of VeEX Inc.
Downstream Performance QAM Analyzer MER 64-QAM: 27 dB min 256-QAM: 31 dB min Pre- and post-FEC BER Constellation Confidential & Proprietary Information of VeEX Inc.
Downstream Performance Pre/Post-FEC BER Confidential & Proprietary Information of VeEX Inc.
Modulation Error Ratio Modulation Quality Modulation error = Transmitted symbol – Target symbol Q Modulation error Target symbol Transmitted (or received) symbol I Source: Hewlett-Packard Confidential & Proprietary Information of VeEX Inc.
Q I Q I Modulation Error Ratio MER = 10log (avg symbol power/avg error power) Q A large “cloud” of symbol points means low MER—this is not good! Average error power Average symbol power A small “cloud” of symbol points means high MER—this is good! I Source: Hewlett-Packard Confidential & Proprietary Information of VeEX Inc.
Constellation Display Poor CNR or Low MER I-Q Imbalance Confidential & Proprietary Information of VeEX Inc.
Constellation Display Phase Jitter/Noise Coherent Interference Confidential & Proprietary Information of VeEX Inc.
Constellation Display Gain Compression Upstream Laser Clipping Gain Compression Confidential & Proprietary Information of VeEX Inc.
Constellation Display Quadrature Distortion Zoom Function Confidential & Proprietary Information of VeEX Inc.
Linear Distortions Equalizer graph In-channel frequency response In-channel group delay Un-equalized-equivalent constellation and MER Confidential & Proprietary Information of VeEX Inc.
Linear Distortions Micro-reflection at about 2.5 µs (2500 ns): Assume ~1 ns per ft, 2500/2 = 1250 ft (actual is 1.17 ns per ft: (2500/1.17)/2 = 1068 ft) Frequency response ripple ~400 kHz p-p: Distance to fault = 492 x (.87/.400) = 1070 ft Confidential & Proprietary Information of VeEX Inc.
Linear Distortions In-Depth Understanding ECHO MARGIN The Coefficients of the Equalizer will also reveal the presence of an Echo (a.k.a. micro-reflections). The Equalizer will cancel such an echo, and in doing so, the Equalizer coefficient which corresponds to the delay of the Echo will be much higher than the surrounding ones -- “it sticks out of the grass”. The relative amplitude of this Coefficient is an indication of the seriousness of the Echo, and its position gives the delay of the Echo, hence its roundtrip distance.The Echo Margin is the smallest difference between any Coefficients and a template defined by Cablelabs, as a safety margin before getting too close to the “cliff effect”. It is normal to notice relatively high Coefficients close to the Reference as this corresponds to the filters in the modulator/demodulator pair and to the shape of QAM signal. EQUALIZER STRESS The Equalizer Stress is derived from the Equalizer Coefficients and indicates how much the Equalizer has to work to cancel the Linear distortions -- it is a global indicator of Linear distortions. The higher the figure, the less stress. NOISE MARGIN We all know that the lower the MER, the larger the probability of errors in transmission (Pre-FEC and then Post-FEC); the MER degrades until errors are so numerous that adequate signal recovery is no longer possible (cliff effect). Since Noise is a major contributor to the MER, we define Noise Margin as the amount of Noise that can be added to a signal (in other words, how much we can degrade MER) before getting dangerously close to the cliff effect. Noise is chosen because on the one hand it is always present, and on the other hand it is mathematically tractable. Other impairments, such as an Interferer, are not easily factored into error probabilities. Confidential & Proprietary Information of VeEX Inc.
Linear Distortions In-Depth Understanding EQUALIZED MER vs. UN-EQUALIZED MER The Modulation Error Ratio (MER) is the ratio of the QAM signal to Non-Linear distortions of the incoming QAM signal. The MER should have included the Linear distortions to indicate the health of the signal; but the QAM demodulator cannot operate properly without the Equalizer and the Equalizer uses the MER as a tool to adaptively cancel the Linear distortions. Consequently it is convenient to distinguish the MER (non-Linear distortions only) from an Un-equalized MER (non-Linear and Linear distortions). The Un-equalized MER is calculated from the MER and Equalizer Stress. The Un-equalized MER is always worse than the MER. A small difference between the two indicates little Linear distortions, while a large difference shows that there are strong Linear distortions. Even if the Linear distortions are cancelled by the Equalizer, we have to keep in mind that the Equalization is a dynamic process as it tracks Linear distortions by trial and error even after converging. The larger the Linear distortions, the larger the tracking transients are, hence more probability of transmission error (Pre-FEC or Post-FEC BER). PHASE JITTER Phase Jitter is caused by instability of the carrier of the QAM signal at the demodulator. This instability could be found at the QAM modulator and up-converter or in the QAM receiver (Local Oscillators used in frequency conversions). Phase Jitter introduces a rotation of the constellation, where the symbol clusters elongate and get closer to the symbol’s boundary. Eventually some symbols will cross the boundary and cause an error in transmission. The QAM demodulator has a Phase lock loop to track phase variations of the carrier; it easily tracks long term drift as well as some short terms variations (up to 10 or 30kHz), but it cannot track very fast variations above its loop response. So in a QAM demodulator, the wideband Jitter is more damageable than short term Jitter. Confidential & Proprietary Information of VeEX Inc.
Linear Distortions Recommendations TABLE 1 DOCSIS SPECIFICATIONS, DOWNSTREAM Confidential & Proprietary Information of VeEX Inc.
Linear Distortions Recommendations TABLE 2 DOCSIS SPECIFICATIONS, UPSTREAM TABLE 3 SCTE STANDARDS Confidential & Proprietary Information of VeEX Inc.
Operational RF Levels Confidential & Proprietary Information of VeEX Inc.
Upstream Performance Cable Modem • Step-by-step Cable Modem link up process to clearly identified failed step. • After link up, power level on forward and return paths are measured. Confidential & Proprietary Information of VeEX Inc.
Upstream Performance Cable Modem IP Confidential & Proprietary Information of VeEX Inc.
Troubleshooting Integrated Upconverter • Verify correct average power level • Integrated upconverter RF output should be set in the DOCSIS-specified +50 to +61 dBmV range • Typical levels are +55 to +58 dBmV • Also check BER, MER, and Constellation Confidential & Proprietary Information of VeEX Inc.
Troubleshooting External Upconverter • Verify correct average power level, BER, MER, and Constellation • CMTS downstream IF output • External upconverter IF input • External upconverter RF output Confidential & Proprietary Information of VeEX Inc.
Combiner Output and Fiber Link • Check signal levels and BER at downstream laser input and node output • Bit errors at downstream laser input but not at CMTS or upconverter output may indicate Sweep transmitter interference, loose connections, or combiner problems • Bit errors at node output but not at laser input are most likely caused by downstream laser clipping Confidential & Proprietary Information of VeEX Inc.
In the field… • If everything checks out OK at the node, go to the affected subscriber’s premises. • Measure downstream RF levels, MER and BER, and evaluate the constellation for impairments. Look at the adaptive equalizer graph, in-channel frequency response and group delay. If your QAM analyzer supports it, repeat these measurements in the upstream. • Measure upstream transmit level and packet loss. • Use the “divide-and-conquer” technique to locate the problem. Confidential & Proprietary Information of VeEX Inc.
Measurement & Troubleshooting Summary • Constellation display • Low MER or CNR • Phase noise • I-Q imbalance • Coherent interference • (ingress, beats) • Gain compression • Laser clipping • Sweep transmitter interference • Pre- and post-FEC BER • Sweep transmitter interference • Laser clipping • Loose connections • Low MER or CNR • Equalizer graph • Micro-reflections • Linear distortions • Adaptive equalizer graph • In-channel frequency response • In-channel group delay • Constellation display (Unequalized) • MER (Unequalized) • Transient impairments • Pre- and post-FEC BER • Constellation display zoom function • Upstream packet loss • Signal level problems • Analog TV channel signal level • Digital channel power • Upstream transmit level • Constellation display Confidential & Proprietary Information of VeEX Inc.
Thank you. Any questions? Confidential & Proprietary Information of VeEX Inc.