Download
1 / 14
140 likes | 256 Vues
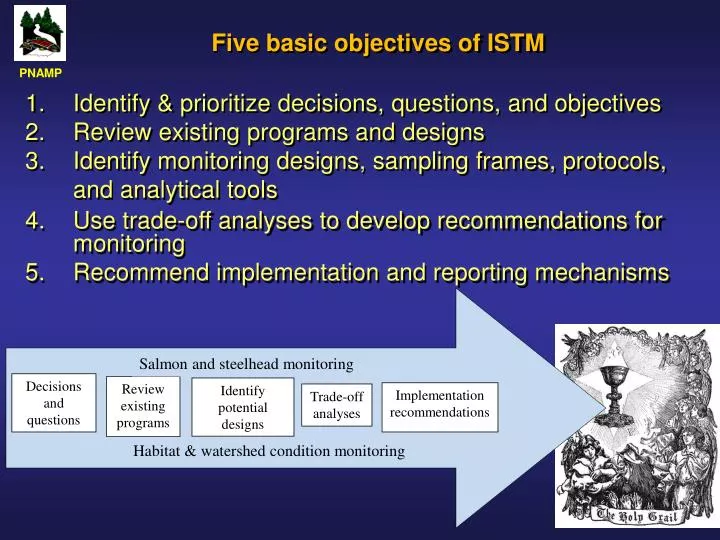
Five basic objectives of ISTM. Identify & prioritize decisions, questions, and objectives Review existing programs and designs Identify monitoring designs, sampling frames, protocols, and analytical tools Use trade-off analyses to develop recommendations for monitoring

E N D
Five basic objectives of ISTM Identify & prioritize decisions, questions, and objectives Review existing programs and designs Identify monitoring designs, sampling frames, protocols, and analytical tools Use trade-off analyses to develop recommendations for monitoring Recommend implementation and reporting mechanisms Salmon and steelhead monitoring Decisions and questions Review existing programs Identify potential designs Implementation recommendations Trade-off analyses Habitat & watershed condition monitoring PNAMP
Fish ISTM – Objective 1 Completed • Identified and prioritized VSP monitoring needs and fish related critical uncertainty research needs in Lower Columbia: • Thematically • Spatially • Temporally • Certainty
Fry/Parr Index:Juvenile MigrantsAdult RecruitsSpawnersAge StructureMigration/Spawning TimingSexOriginFry/Parr Spatial StructureSpawner Spatial Structure Prioritized Indicators
Filters • Recovery Priority • 3 - Primary populations (i.e. low or very low risk) are high priority • 2 - Contributing populations (i.e. moderate risk) are moderate priority • 1 - Stabilizing populations (i.e. high or very high risk) are low priority • Current Natural Origin Abundance • 3 - average of >500 natural origin spawners over last six years • 2 - average of 100-500 natural origin spawners over last six years • 1 - average of <100 natural origin spawners over last six years • In/Out Potential • 3 - High priority where existing infrastructure and methods allow for an unbiased and precise adult and smolt abundance estimates (CV < 15%) for a substantial portion of the population area (>30%) • 2 - Moderate priority where existing infrastructure and methods allow for an unbiased and precise adult and smolt abundance estimates (CV < 15%) for a small portion of the population area (<30%) • 1 - Low priority where existing infrastructure and methods do not allow for unbiased and precise adult and smolt abundance estimates (CV > 15%) • Special Case • 3 -High priority • 2 - Moderate priority • 1 - Low Priority
Calculations • Relative Indicator Score = (Raw Indicator Score) x (Recovery Priority Score) x (Current Abundance Score) x (Fish In/Fish Out Score) x (Special Cases Score) • Total Species Population Score = ∑Relative Indicator Scores for a Species & Population
Objective 2: Existing Data & Gaps • Confirm/finalize inventory of existing monitoring data (296) • Compile any important LCR datasets not already obtained (127) • Create data flow diagrams for each data collection effort • Develop metadata for each existing monitoring data collection effort • Develop standards for terminology (a data dictionary) • Document sampling protocols • Document data availability schedule • Detail current data storage, analysis, reporting & dissemination infrastructure • Identify needed data exchange templates for sub-regional & regional data sharing • Gather input on desired features of a data management system from data contributors
Indicators or Reporting Measures Very High Level Indicator High Level Indicators Metrics Measurements PNAMP Partners (start with recovery plans) Spatial Scales Sampling Interval Need/Rationale Certainty • Gaps • Commonalities • Rosetta Stone