Download
1 / 14
140 likes | 291 Vues
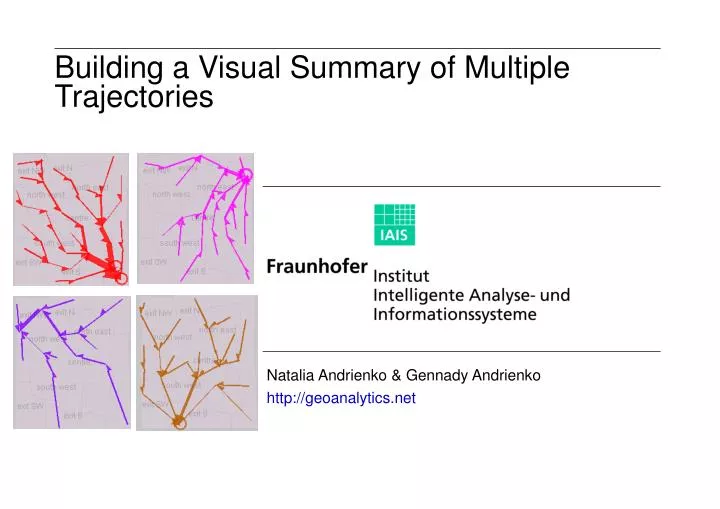
Building a Visual Summary of Multiple Trajectories. Natalia Andrienko & Gennady Andrienko http://geoanalytics.net. Introduction. Problem statement.

E N D
Building a Visual Summary of Multiple Trajectories Natalia Andrienko & Gennady Andrienko http://geoanalytics.net
Problem statement • Given: data about movement of multiple objects {<o, t, x, y>}.o { o1, o2, …, oN }; t0 ≤ t ≤ tmaxTrajectory: {<o, tk, x, y>} where o = const, tk > tk-1 for k>1 • Example: movement of vehicles and/or pedestrians in a city • Problem: represent groups of spatially similar trajectories in a summarised form. • E.g. trajectories with close starts and/or close ends and/or similar routes • Such groups may be found e.g. by means of clustering • Purposes: • Promote abstraction, understanding of common spatial features • Reduce display clutter and overlapping of symbols
Example: trajectories of cars in Milan Trajectories on Wednesday morning (6591 trajectories, shown with 20% opacity) Result of density-based clustering by route similarity (noise excluded)
Some of the 45 clusters How can we see several (all) clusters at once? How can we compare the clusters?
A summarised representation (graphical spatial model) of a cluster
How is it done? Divide the territory using a suitable mesh* Transform each trajectory into a sequence of moves between areas (cells of the mesh) Count the moves between pairs of areas Represent by arrows with varying thickness * Voronoi polygons built around characteristic points
Sensitivity to generalisation parameters Radius 1000m: Radius 2000m: Radius 3000m:
Groups of trajectories with close ends (or close starts) 47 clusters (noise excluded)
Further work • Numeric estimation of displacement • Minimization of displacement • User evaluation • Application to trajectories stored in a database • Extending the method to spatio-temporal summarisation