Download
1 / 1
10 likes | 162 Vues
Assessment of Riparian C onditions in the South Fork Nooksack R iver B asin with the C ombination of LiDAR , Multi-spectral I magery and GIS. Erica Capuana Huxley College of the Environment, Western Washington University. Introduction

E N D
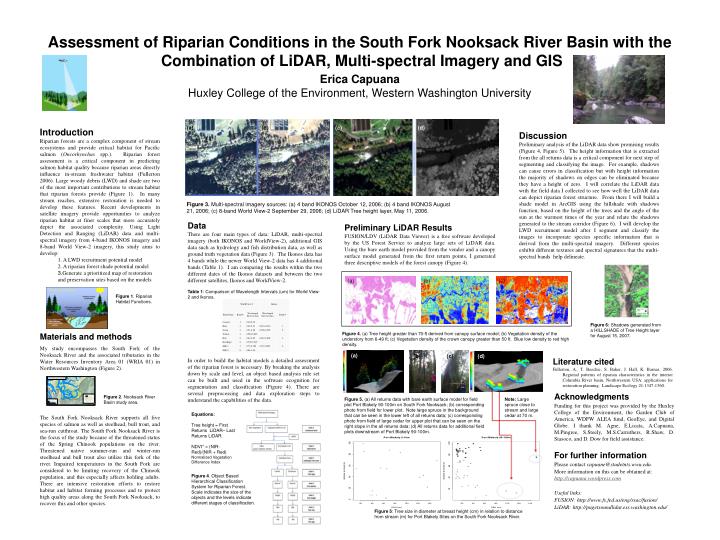
Assessment of Riparian Conditions in the South Fork Nooksack River Basin with the Combination of LiDAR, Multi-spectral Imagery and GIS Erica CapuanaHuxley College of the Environment, Western Washington University Introduction Riparian forests are a complex component of stream ecosystems and provide critical habitat for Pacific salmon (Oncorhynchus spp.). Riparian forest assessment is a critical component in predicting salmon habitat quality because riparian areas directly influence in-stream freshwater habitat (Fullerton 2006). Large woody debris (LWD) and shade are two of the most important contributions to stream habitat that riparian forests provide (Figure 1). In many stream reaches, extensive restoration is needed to develop these features. Recent developments in satellite imagery provide opportunities to analyze riparian habitat at finer scales that more accurately depict the associated complexity. Using Light Detection and Ranging (LiDAR) data and multi-spectral imagery from 4-band IKONOS imagery and 8-band World View-2 imagery, this study aims to develop: 1. A LWD recruitment potential model 2. A riparian forest shade potential model 3.Generate a prioritized map of restoration and preservation sites based on the models Discussion Preliminary analysis of the LiDAR data show promising results (Figure 4, Figure 5). The height information that is extracted from the all returns data is a critical component for next step of segmenting and classifying the image. For example, shadows can cause errors in classification but with height information the majority of shadows on edges can be eliminated because they have a height of zero. I will correlate the LiDAR data with the field data I collected to see how well the LiDAR data can depict riparian forest structure. From there I will build a shade model in ArcGIS using the hillshade with shadows function, based on the height of the trees and the angle of the sun at the warmest times of the year and relate the shadows generated to the stream corridor (Figure 6). I will develop the LWD recruitment model after I segment and classify the images to incorporate species specific information that is derived from the multi-spectral imagery. Different species exhibit different textures and spectral signatures that the multi-spectral bands help delineate. (a) (b) (c) (d) Figure 3. Multi-spectral imagery sources: (a) 4 band IKONOS October 12, 2006; (b) 4 band IKONOS August 21, 2006; (c) 8-band World View-2 September 29, 2006; (d) LiDAR Tree height layer, May 11, 2006. Data There are four main types of data: LiDAR, multi-spectral imagery (both IKONOS and WorldView-2), additional GIS data such as hydrology and fish distribution data, as well as ground truth vegetation data (Figure 3). The Ikonos data has 4 bands while the newer World View-2 data has 4 additional bands (Table 1). I am comparing the results within the two different dates of the Ikonos datasets and between the two different satellites, Ikonos and WorldView-2. Table 1: Comparison of Wavelength Intervals (um) for World View-2 and Ikonos. Preliminary LiDAR Results FUSION/LDV (LiDAR Data Viewer) is a free software developed by the US Forest Service to analyze large sets of LiDAR data. Using the bare earth model provided from the vendor and a canopy surface model generated from the first return points, I generated three descriptive models of the forest canopy (Figure 4). Figure 1. Riparian Habitat Functions. Figure 6: Shadows generated from a HILLSHADE of Tree Height layer for August 15, 2007. Materials and methods My study encompasses the South Fork of the Nooksack River and the associated tributaries in the Water Resources Inventory Area 01 (WRIA 01) in Northwestern Washington (Figure 2). The South Fork Nooksack River supports all five species of salmon as well as steelhead, bull trout, and sea-run cutthroat. The South Fork Nooksack River is the focus of the study because of the threatened status of the Spring Chinook populations on the river. Threatened native summer-run and winter-run steelhead and bull trout also utilize this fork of the river. Impaired temperatures in the South Fork are considered to be limiting recovery of the Chinook population, and this especially affects holding adults. There are intensive restoration efforts to restore habitat and habitat forming processes and to protect high quality areas along the South Fork Nooksack, to recover this and other species. Figure 4. (a) Tree height greater than 70-ft derived from canopy surface model; (b) Vegetation density of the understory from 6-49 ft; (c) Vegetation density of the crown canopy greater than 50 ft. Blue low density to red high density. In order to build the habitat models a detailed assessment of the riparian forest is necessary. By breaking the analysis down by scale and level, an object based analysis rule set can be built and used in the software ecognition for segmentation and classification (Figure 4). There are several preprocessing and data exploration steps to understand the capabilities of the data. Literature cited Fullerton, A., T. Beechie, S. Baker, J. Hall, K. Barnas. 2006. Regional patterns of riparian characteristics in the interior Columbia River basin, Northwestern USA: applications for restoration planning. Landscape Ecology 21:1347-1360. (a) (b) (c) (d) (c) (a) (b) Acknowledgments Funding for this project was provided by the Huxley College of the Environment, the Garden Club of America, WDFW ALEA fund, GeoEye, and Digital Globe. I thank M. Agne, E.Licata, A.Capuana, M.Pingree, S.Steely, M.S.Carruthers, R.Shaw, D. Siasoco, and D. Dow for field assistance. Figure 2. Nooksack River Basin study area. Figure 5. (a) All returns data with bare earth surface model for field plot Port Blakely 90-100m on South Fork Nooksack; (b) corresponding photo from field for lower plot. Note large spruce in the background that can be seen in the lower left of all returns data; (c) corresponding photo from field of large cedar for upper plot that can be seen on the right slope in the all returns data; (d) All returns data for additional field plots downstream of Port Blakely 90-100m. Note: Large spruce close to stream and large cedar at 70 m. Equations: Tree height = First Returns LiDAR– Last Returns LiDAR. NDVI* = (NIR-Red)/(NIR + Red) Normalized Vegetation Difference Index For further information Please contact capuane@studetnts.wwu.edu. More information on this can be obtained at: http://capuana.wordpress.com Useful links: FUSION: http://www.fs.fed.us/eng/rsac/fusion/ LiDAR: http://pugetsoundlidar.ess.washington.edu/ Figure 4. Object Based Hierarchical Classification System for Riparian Forest. Scale indicates the size of the objects and the levels indicate different stages of classification. Figure 5: Tree size in diameter at breast height (cm) in relation to distance from stream (m) for Port Blakely Sites on the South Fork Nooksack River.