Download
1 / 8
80 likes | 315 Vues
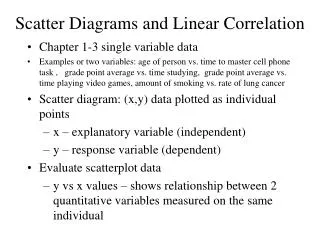
Scatter Plots and Linear Correlation. How do you determine if something causes something else to happen?. We want to see if the dependent variable (response variable) is affected by another variable, the independent variable (explanatory variable).

E N D
How do you determine if something causes something else to happen? We want to see if the dependent variable (response variable) is affected by another variable, the independent variable (explanatory variable). Linear correlation if changes in one variable tend to be proportional to changes in the other.
Variables x and y have a perfect positive (direct) linear correlation if y increases at a constant rate as x increases. Similarly, x and y have a perfect negative (inverse) linear correlation if y decreases at a constant rate as x increases. Inverse Direct
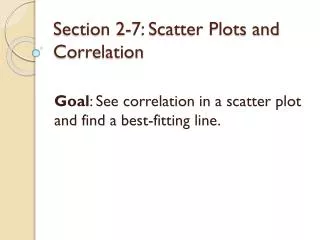
A scatter plot shows the relationship using the independent variable on the horizontal axis and the dependent variables on vertical. The line of best fit is the line that passes as close as possible to all of the points on a scatter plot. The stronger the correlation, the more closely the data points cluster around the line of best fit.
We need to be able to measure a way that a correlation can be given between two variables. Karl Pearson (1857 – 1936) developed a formula that can help us estimate a way to measure correlation. Mathematicians first defined the COVARIANCE of two variables in a sample. Question: When will the covariance be negative?
Correlation Coefficient the covariance divided by the product of the deviations for x and y. This gives us a quantitative measure for linear correlation and tells us how close the data points hug the line of best fit. It is also called the Pearson product-moment coefficient of correlation (PPMC) or Pearson’s r.
It has ranges between –1 and 1. If r =1, then we have a strong positive correlation. If r = -1, then we have a strong negative correlation. Another equation was created by Pearson that allows us to find the standard deviation without calculating all of the deviation manually.
When doing a question, it is essential to identify what is the independent and dependent variable. Why is this the case? Homework Pg 168 # 1,2abc,3,6