Download
1 / 19
190 likes | 443 Vues
Time Series Data Analysis - II. Yaji Sripada. In this lecture you learn. Structural representations of time series SAX Computing SAX Data analysis using SAX Visualization using SAX. Introduction. Time series exhibit an internal structure

E N D
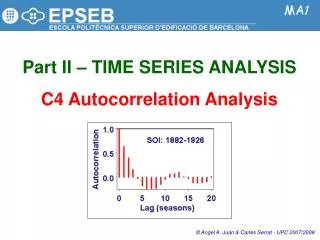
Time Series Data Analysis - II Yaji Sripada
In this lecture you learn • Structural representations of time series • SAX • Computing SAX • Data analysis using SAX • Visualization using SAX Dept. of Computing Science, University of Aberdeen
Introduction • Time series exhibit an internal structure • Elements of this structure have domain specific meanings • E.g. a scuba dive is composed of • one or more descent segments, • one or more bottom segments and • finally one or more ascent segments in that order • These segments have specific meaning in the domain of scuba diving • The structural elements of a time series are usually approximations (abstractions) of the original data • Experts in any domain reason in terms of these abstractions and not in terms of the original time series • Understanding time series = understanding their structure Dept. of Computing Science, University of Aberdeen
Several structural representations • Time series can be represented in terms of • Linear segments (we already saw this last week) • Aggregate Approximations (will study in this lecture) • Non-linear segments (Not in this course) • Wavelets (involve complex mathematics – not in this course) • And many more • The primary motivation behind creating the above structural representations is time series data mining Dept. of Computing Science, University of Aberdeen
Which structure is the most useful? • All these structural representations are useful • may be more used in some application domains than others • A good representation exhibits meaningful structure • But meaning is attributed to a structure based on domain knowledge and user tasks • This means, select a representation that helps easy computation of meaning • Our approach to selecting the right representation • Based on the domain KA we learn the trends and patterns that are meaningful • Select one or more representations that facilitate the computation of required trends and patterns Dept. of Computing Science, University of Aberdeen
Symbolic Aggregate Approximation (SAX) • A recently developed symbolic representation of time series is claimed to facilitate easy pattern computation • http://www.cs.ucr.edu/~eamonn/SAX.htm is the main SAX page • We introduced this representation in the last lecture • We study how to create this representation in this lecture because it allows • Novel data analysis of time series and • Novel visualization of time series • We will study briefly data analysis and visualization with SAX • The above link has all the required details for further study Dept. of Computing Science, University of Aberdeen
Creating SAX • Input • Real valued time series (blue curve) • Output • Symbolic representation of the input time series (red string) • Process • First convert the input series into piecewise aggregate approximation (PAA) representation (grey steps) • Then convert the PAA into a string of symbols (red string) PAA Input Series SAX baabccbc Dept. of Computing Science, University of Aberdeen
Example Data Dept. of Computing Science, University of Aberdeen
Creating PAA • Normalize the input time series • Subtract the mean from each value and divide the deviation with standard deviation • Divide input time series of length n into w portions of equal length • w is the parameter that controls the length of PAA and therefore the length of SAX • If w is large you have a detailed (fine) PAA and a detailed SAX • If w is small you have an abstract (coarse) PAA and an abstract SAX • Choice of w should be based on the application requirements Dept. of Computing Science, University of Aberdeen
Creating PAA (2) • Two cases • n/w is a whole number • Simple case of each portion having n/w number of values from the input time series • n/w is a fraction • Complicated case because you cannot assign equal number of whole numbered values from the input series to w equal sized portions • Our example data has n = 14 • If w = 3, then n/w is a fraction • The length of each portion is 14/3 = 4.66667 • Each portion should have 4.66667 values from the original time series Dept. of Computing Science, University of Aberdeen
Creating PAA (3) • We use the following scheme to achieve 4.6667 values in each portion • The following is the list of indexes of the 14 values in a input series 1 2 3 4 5 6 7 8 9 10 11 12 13 14 • The first portion will have values at 1, 2, 3, and 4 • We need 0.6667 more to complete this portion • We achieve this by inserting 0.6667 times the 5th value • The remaining 0.3333 times the 5th value is inserted into the second portion Dept. of Computing Science, University of Aberdeen
Creating PAA (4) • Using the above scheme our three lists are • 4.2, 9.2, 14.8, 15 and 0.6667*17 • 0.3333*17, 18, 19.7, 20, 20.8, 0.3333*21.3 • 0.6667*21.3, 21.6, 20.6, 16.9, 12.8 • (Note: here we have shown the values from the un-normalized input series) • Each of the above sublists have equal portions from the input series • Next for each of the sublists compute the average (mean) • In our case, three sublists will each have an average value • PAA is simply a vector of these average values • {avg1, avg2, avg3} • {-0.9338,0.53135,0.34767} for our example (using normalized values) Dept. of Computing Science, University of Aberdeen
Properties of PAA • PAA is simple to compute (as can be seen from the previous slides) • Achieves dimensionality reduction • From 14 values our input series is reduced to 3 values • Any similarities computed on the PAA will be true on input series as well • Lower bounding distance • Very useful property for a structural representation • Allows data analysis to be performed on the approximate representation rather than the original series Dept. of Computing Science, University of Aberdeen
Symbol Mapping • In this step, each average value from the PAA vector is replaced by a symbol from an alphabet • An alphabet size, a of 5 to 8 is recommended • a,b,c,d,e • a,b,c,d,e,f • a,b,c,d,e,f,g • a,b,c,d,e,f,g,h • Given an average value we need a symbol • This is achieved by using the normal distribution from statistics • Because our input series is normalized we can use normal distribution as the data model • We divide the area under the normal distribution into ‘a’ equal sized areas where a is the alphabet size • Each such area is bounded by breakpoints Dept. of Computing Science, University of Aberdeen
Symbol mapping - breakpoints • Breakpoints for different alphabet sizes can be structured as a lookup table • When a=3 • Average values below -0.43 are replaced by ‘A’ • Average values between -0.43 and 0.43 are replaced by ‘B’ • Average values above 0.43 are replaced by ‘C’ • Using this table, SAX for our input series is ‘ADD’ Dept. of Computing Science, University of Aberdeen
c c c b b b a a - - 0 0 40 60 80 100 120 20 SAX Computation – in pictures C C 0 20 40 60 80 100 120 This slide taken from Eamonn’s Tutorial on SAX baabccbc Dept. of Computing Science, University of Aberdeen
Data Analysis using SAX • A general approach is to convert time series into SAX • Use SAX representations to train Markov models (details not here) on normal data • The model captures the probabilities of normal patterns • The trained models are then used to test incoming data for known and unknown patterns Dept. of Computing Science, University of Aberdeen
Visualization using SAX Mark Frequencies • Given a SAX representation • count the frequencies of patterns (substrings) of required length and • use them to color code a mosaic for visualizing time series • For example, given ‘baabccbc’ as the SAX representation • We calculate the frequencies of substrings of length 1 and represent them in a mosaic • Visualizations for substrings of length>1 are possible (please refer to the SAX site) Normalize Color code cells Dept. of Computing Science, University of Aberdeen
Summary • Structural representations help in understanding time series through • Data analysis + Visualization • SAX is claimed to be a landmark representation of time series • Symbolic and therefore allows use of discrete data structures and their corresponding algorithms for analysis • Also helps with visualization Dept. of Computing Science, University of Aberdeen