Download
1 / 30
320 likes | 475 Vues
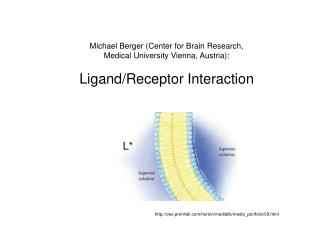
The AFM detection of ligand-receptor interaction on a surface of living cells Małgorzata Lekka. atomic force microscopy. Position Sensitive Photodiode. Laser. F N. Cantilever. AFM working in IFJ. F L. Sample. Scanner. Tip. force spectroscopy. scanner linearization

E N D
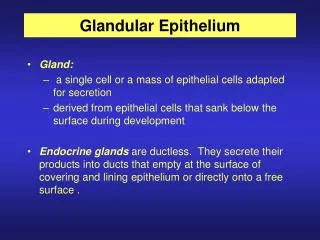
The AFM detection of ligand-receptor interaction on a surface of living cellsMałgorzata Lekka
atomic force microscopy Position Sensitive Photodiode Laser FN Cantilever AFM working in IFJ FL Sample Scanner Tip
force spectroscopy scanner linearization spring constant • A–B signal • geometry: • = 10º tip – shape Hoh et al.
scanner linearization photodiode laser scanner
resonant frequency of a thermally excited cantilever withoutprotein (conA) nominal value = 7 kHz, k = 0.01 N/m measured value = 5.8 kHz, k = 0.007 N/m • with protein (conA) • 0.3 mg/ml • = 5.8 kHz, k = 0.007 N/m • 1 mg/ml • = 5.4 kHz, k = 0.006 N/m ! Sader et al.
k = 0.03 N/m RT Fmin 11 pN
probe Standard TGT01 Si3N4 + APTES (4%) + GL (2.5%) + conA (0.3 g/ml) Si3N4+ APTES (4%) + glutaraldehyde (GL; 2.5%) R = 54 +/- 7 nm R = 275 +/- 10 nm
number of molecules on probe probe size protein concentration immobilization procedure Grandbois et al. Single molecular pair Moy et al.
rough estimation of the bond strength + hydrophobic forces
Distribution of vitronectin receptors on a living MC3T3-E1 cell (murine osteoblastic cell) Kim et al.
AFM tip functionalized with Helix pomatia N-acetylgalactosamine in membrane of group A of RBC mixed red blood cells Grandbois et al.
No of events Force [nN]
ConA-CaY retraction velocity 3.5 μm/s 0.3 s No of events 5 s Force [nN]
How to check what it is measured ? • not functionalized AFM probe • measurements of known ligand-receptor pair HCV 29 cells silicon nitride tip
blocking of the binding sites free amount of ligand in solution CaY– Con A all or certain number of binding sites can be blocked CaY – Con A + 1 mg/ml Con A interaction between ligand – receptor pair non-specific interaction
HCV 29non–malignant transitional epithelial cells of ureter different types of interaction characteristic for cancerous cells AFM, contact mode T24 transitional cell cancer of urine bladder
lectins PHA-L SNA ConA carbohydrates mannose, glucose sialic acid N-acetylglucosamine
verification 50 µg/ml ConA
conclusions • AFM allows detecting molecular interaction on a surface of living cell • The spatial arrangement of functional carbohydrate groups on cell surface was attributed to the density of all types of the carbohydrate structures (mannose, N-acetylglucosamine, sialic acids). • The maximum range of force distribution (presented in histograms up to 1.2 nN), the size of the adhesion spot (i.e. one single point on the distribution map ~ 0.95 μm2), the number of bonds (2–3 for cancerous cells) suggested that ligands present on a surface of T24 cells formed groups composed of several single carbohydrate chains involved in adhesion process in the lectin recognition.
Institute of Medical Biochemistry Medical College Jagiellonian University Piotr Laidler Joanna Dulińska Maryla Łabędź The Henryk Niewodniczański Institute of Nuclear Physics Polish Academy of Sciences Zbigniew Stachura Małgorzata Lekka Janusz Lekki Jan Styczeń PhD students Joanna Gryboś Kateryna Lebed Grażyna Pyka Atomic Force Microscopy
Histogram Autocorrelation function force between single pair: CaY-ConA F = 960 +/- 110 pN bin size large number of data
= m· F + F0 m =m2 F0– non-specific force f1(F, F2, F0 )· f2(F, F2, F0 ) more complex interactions F const single interaction F const F · F0