Download
1 / 15
150 likes | 154 Vues
CHAPTER 5 Probability: What Are the Chances?. 5.1 Randomness, Probability, and Simulation. Randomness, Probability, and Simulation. INTERPRET probability as a long-run relative frequency. USE simulation to MODEL chance behavior. 1 in 6 Activity.

E N D
CHAPTER 5Probability: What Are the Chances? 5.1 Randomness, Probability, and Simulation
Randomness, Probability, and Simulation • INTERPRET probability as a long-run relative frequency. • USE simulation to MODEL chance behavior.
1 in 6 Activity • A company runs a special promotion on its 20-ounce sodas by printing a message inside of the cap. Some caps say “Please try again”, while others say “You’re a winner!” The company advertised the promotion with the slogan, “1 in 6 wins a prize.” The prize is a free 6 pack of soda. • Seven friends each buy one bottle of soda and the store clerk is surprised to find that three of them win a prize. This worries the store clerk since they may lose money from giving away too many free sodas. Is this group just lucky, or is there a problem with this soda promotion? • For now, let’s assume that the company is telling the truth, and that each bottle does indeed have a 1 in 6 chance of winning. How can we set up a simulation to test this promotion and find out if the group is just lucky, or if there may be some error in the promotion? • What percent of the time, in our simulations did the friends come away with three prizes? Less than 3? More than 3? Is the company telling the truth about their prize game?
What is probability? • Can we create our own definition for probability? What would yours be? • What was the probability in the Soda Example we just did? • What number range represents probability?
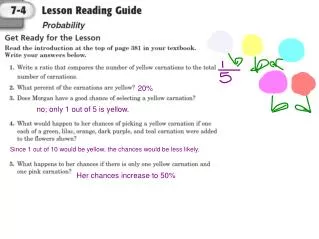
Check Yo’ Understandin’ • According to the Book of Odds website, the probability that a randomly selected U.S. adult usually eats breakfast is .61. a. What does .61 mean? b. Why doesn’t this probability say that if 100 U.S. adults are chosen at random, exactly 61 of them usually eat breakfast? 2. Match the probabilities that follow with each statement. 0 0.01 0.3 0.6 0.99 1 • The outcome is impossible, it can never occur. • This outcome is certain… it will occur every time. • This outcome is very unlikely, but it will occur once in a while in a long sequence of trials. • This outcome will occur more often than not.
Heads or Tails? • Are coins fair? When flipping a coin, does heads appear more than tails? Let’s test it out. • Each student will flip a coin ten times to see how many times they get heads. • What percent do we expect to get? What percent did we get? Why is there a difference, if there was one? • Combine student results into a class summary using a table. Analyze percentage after each student adds their results. • Will coins always be fifty percent accurate? How can we prove that? While doing our coin toss activity, when will heads be 50%?
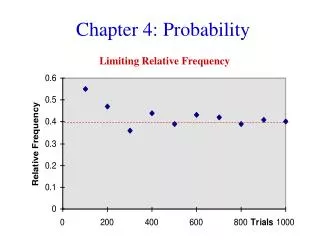
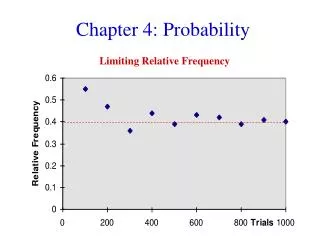
The Idea of Probability Chance behavior is unpredictable in the short run, but has a regular and predictable pattern in the long run. The law of large numbers says that if we observe more and more repetitions of any chance process, the proportion of times that a specific outcome occurs approaches a single value. The probability of any outcome of a chance process is a number between 0 and 1 that describes the proportion of times the outcome would occur in a very long series of repetitions.
Myths About Randomness The idea of probability seems straightforward. However, there are several myths of chance behavior we must address. The myth of short-run regularity: The idea of probability is that randomness is predictable in the long run. Our intuition tries to tell us random phenomena should also be predictable in the short run. However, probability does not allow us to make short-run predictions. The myth of the “law of averages”: Probability tells us random behavior evens out in the long run. Future outcomes are not affected by past behavior. That is, past outcomes do not influence the likelihood of individual outcomes occurring in the future.
Wait a minute… • How does the Law of Averages relate to the coin example and the soda example? • How does the Law of Averages affect a basketball player with a hot hand? • Does that mean that a player is more likely to make or miss a shot? • What does this mean about a player that is slumping?
How to Run a Simulation • We can recreate statistical problems and test them using them same probabilities by doing simulations. The following steps are the steps for doing a simulation, but out of order. With your partner, put the steps for doing a simulation in order… They are: Do: Perform many repetitions of the simulation. Conclude: Use the results of your simulation to answer the question of interest. State: Ask a question of interest about some chance process. Plan: Describe how to use a chance device to imitate one repetition of the process. Tell what you will record at the end of each repetition.
Simulation The imitation of chance behavior, based on a model that accurately reflects the situation, is called a simulation. Performing a Simulation State: Ask a question of interest about some chance process. Plan: Describe how to use a chance device to imitate one repetition of the process. Tell what you will record at the end of each repetition. Do: Perform many repetitions of the simulation. Conclude: Use the results of your simulation to answer the question of interest. We can use physical devices, random numbers (e.g. Table D), and technology to perform simulations.
Example: Simulations with technology In an attempt to increase sales, a breakfast cereal company decides to offer a NASCAR promotion. Each box of cereal will contain a collectible card featuring one of these NASCAR drivers: Jeff Gordon, Dale Earnhardt, Jr., Tony Stewart, Danica Patrick, or Jimmie Johnson. The company says that each of the 5 cards is equally likely to appear in any box of cereal. A NASCAR fan decides to keep buying boxes of the cereal until she has all 5 drivers’ cards. She is surprised when it takes her 23 boxes to get the full set of cards. Should she be surprised? Problem: What is the probability that it will take 23 or more boxes to get a full set of 5 NASCAR collectible cards?
Example: Simulations with technology Plan: We need five numbers to represent the five possible cards. Let’s let 1 = Jeff Gordon, 2 = Dale Earnhardt, Jr., 3 = Tony Stewart, 4 = Danica Patrick, and 5 = Jimmie Johnson. We’ll use randInt(1,5) to simulate buying one box of cereal and looking at which card is inside. Because we want a full set of cards, we’ll keep pressing Enter until we get all five of the labels from 1 to 5. We’ll record the number of boxes that we had to open.
Example: Simulations with technology 3 5 2 1 5 2 3 5 4 9 boxes 5 1 2 5 1 4 1 4 1 2 2 2 4 4 5 3 16 boxes 5 5 5 2 4 1 2 1 5 3 10 boxes 4 3 5 3 5 1 1 1 5 3 1 5 4 5 2 15 boxes 3 3 2 2 1 2 4 3 3 4 2 2 3 3 3 2 3 3 4 2 2 5 22 boxes Conclude: We never had to buy more than 22 boxes to get the full set of NASCAR drivers’ cards in 50 repetitions of our simulation. So our estimate of the probability that it takes 23 or more boxes to get a full set is roughly 0. The NASCAR fan should be surprised about how many boxes she had to buy.
Randomness, Probability, and Simulation • INTERPRET probability as a long-run relative frequency. • USE simulation to MODEL chance behavior.