Download
1 / 32
320 likes | 487 Vues
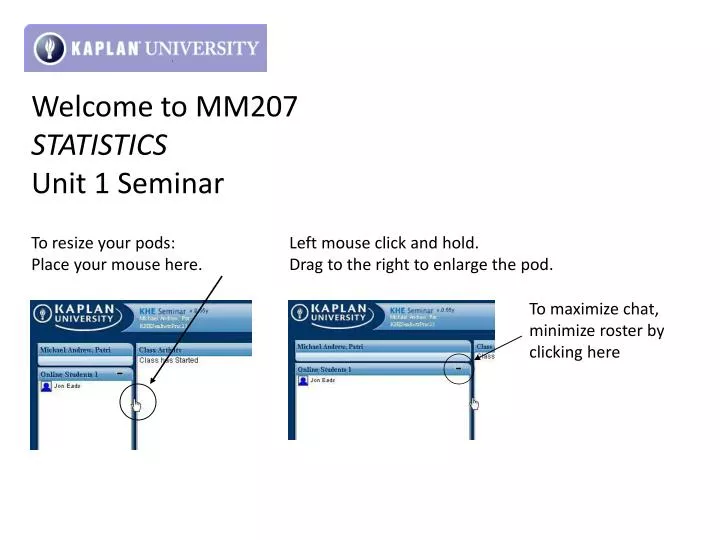
Welcome to MM207 STATISTICS Unit 1 Seminar. To resize your pods: Place your mouse here. Left mouse click and hold. Drag to the right to enlarge the pod. To maximize chat, minimize roster by clicking here. WELCOME TO MM207, Statistics Anthony J. Feduccia. Instructor Contact Information.

E N D
Welcome to MM207STATISTICSUnit 1 Seminar To resize your pods: Place your mouse here. Left mouse click and hold. Drag to the right to enlarge the pod. To maximize chat, minimize roster by clicking here
WELCOME TO MM207, Statistics Anthony J. Feduccia
Instructor Contact Information • Instructor: Anthony J. Feduccia • Email: afeduccia@kaplan.edu • Office hours : By appointment (AIM):mrajfed
ADDITIONAL COURSE RULES ** All learning activities for a unit are due by Tuesday 11:59 pm ET. ** INSTRUCTOR-GRADED PROJECTS more than two weeks late will NOT be accepted. ** Late Instructor- Graded projects will be penalized 10 points for each Unit late (see above). ** Instructor-Graded Projects you submit MUST be signed by typing your name at the top of the project. This is your testimony that the work is yours and was not done by another person. Unsigned projects will be returned ungraded and late penalties will apply. ** Discussion Threads must be posted during the Unit week. ** You must show how you arrived at your answer in Project problems where applicable. Answer alone is not sufficient for full credit.
Unit Assignments Weeks 1 - 8 >Seminar: 5 points or Alt seminar quiz (one try; one hour time limit) You may attend flex seminar >Unit 1 Scavenger Hunt: 15 points >Discussion Board : 30 points >Instructor graded Unit Project: weekly; 40 points >MML Project: weekly; 30 points ------------------------------------------- Cumulative Final Exam: 100 points TOTAL: 1000 points
Seminars (5 points) *Log in early *Keep chatter during seminar to a minimum *Seminar slides in Doc Sharing. Print for note taking. *Alternate seminar is computer-generated, graded quiz. One try. 1 hour time limit. *Flex Seminar:
Discussion Question (30 points) Post early…not on the last day (Tuesday) Read other posts Do not repeat problems already posted Read the question and answer it. This is strictly graded.
Projects (40 points) Due by Tuesday of Unit week by 11:59 PM ET 5 problems Type Name at top of project Word document only. Copy/paste Excel output into Word document. Title in dropbox as: YourName/Project # Show how answer was determined for full credit Answer alone is insufficient. Review before sending
My MathLab (MML) Assignments MML Project (30 points): Multiple tries allowed. Hints, Help available. 5 problems Perform Browser Check Read “How to enter answers” especially decimal points
What is Statistics? Statistics The science of collecting, organizing, analyzing, and interpreting data in order to make decisions. Larson/Farber 4th ed.
Parameter and Statistic Parameter A number that describes a population characteristic. Average age of all people in the United States Statistic A number that describes a sample characteristic. Average age of people from a sample of three states Larson/Farber 4th ed.
Levels of Measurement Nominal level of measurement • Qualitative data only • Categorized using names, labels, or qualities • No mathematical computations can be made Ordinal level of measurement • Qualitative or quantitative data • Data can be arranged in order • Differences between data entries is not meaningful Larson/Farber 4th ed.
Levels of Measurement Interval level of measurement • Quantitative data • Data can ordered • Differences between data entries is meaningful • Zero represents a position on a scale (not an inherent zero – zero does not imply “none”) Larson/Farber 4th ed.
Levels of Measurement Ratio level of measurement • Similar to interval level • Zero entry is an inherent zero (implies “none”) • A ratio of two data values can be formed • One data value can be expressed as a multiple of another Larson/Farber 4th ed.
Simple Random Sample • Random numbers can be generated by a random number table, a software program or a calculator. • Assign a number to each member of the population. • Members of the population that correspond to these numbers become members of the sample. Larson/Farber 4th ed.
Example: Simple Random Sample There are 731 students currently enrolled in statistics at your school. You wish to form a sample of eight students to answer some survey questions. Select the students who will belong to the simple random sample. • Assign numbers 1 to 731 to each student taking statistics. • On the table of random numbers, choose a starting place at random (suppose you start in the third row, second column.) Larson/Farber 4th ed.
Solution: Simple Random Sample • Read the digits in groups of three • Ignore numbers greater than 731 The students assigned numbers 719, 662, 650, 4, 53, 589, 403, and 129 would make up the sample. Larson/Farber 4th ed.
Other Sampling Techniques Stratified Sample • Divide a population into groups (strata) and select a random sample from each group. • To collect a stratified sample of the number of people who live in West Ridge County households, you could divide the households into socioeconomic levels and then randomly select households from each level. Larson/Farber 4th ed.
Other Sampling Techniques Cluster Sample • Divide the population into groups (clusters) and select all of the members in one or more, but not all, of the clusters. • In the West Ridge County example you could divide the households into clusters according to zip codes, then select all the households in one or more, but not all, zip codes. Larson/Farber 4th ed.
Other Sampling Techniques Systematic Sample • Choose a starting value at random. Then choose every kth member of the population. • In the West Ridge County example you could assign a different number to each household, randomly choose a starting number, then select every 100th household. Larson/Farber 4th ed.
Designing a Statistical Study • Collect the data. • Describe the data using descriptive statistics techniques. • Interpret the data and make decisions about the population using inferential statistics. • Identify any possible errors. • Identify the variable(s) of interest (the focus) and the population of the study. • Develop a detailed plan for collecting data. If you use a sample, make sure the sample is representative of the population. Larson/Farber 4th ed.
Data Collection Observational study • A researcher observes and measures characteristics of interest of part of a population. • Researchers observed and recorded the mouthing behavior on nonfood objects of children up to three years old. (Source: Pediatric Magazine) Larson/Farber 4th ed.
Data Collection Survey • An investigation of one or more characteristics of a population. • Commonly done by interview, mail, or telephone. • A survey is conducted on a sample of female physicians to determine whether the primary reason for their career choice is financial stability. Larson/Farber 4th ed.
Data Collection Simulation • Uses a mathematical or physical model to reproduce the conditions of a situation or process. • Often involves the use of computers. • Automobile manufacturers use simulations with dummies to study the effects of crashes on humans. Larson/Farber 4th ed.
Data Collection Experiment • A treatment is applied to part of a population and responses are observed. • An experiment was performed in which diabetics took cinnamon extract daily while a control group took none. After 40 days, the diabetics who had the cinnamon reduced their risk of heart disease while the control group experienced no change. (Source: Diabetes Care) Larson/Farber 4th ed.