Download
1 / 75
790 likes | 1.13k Vues
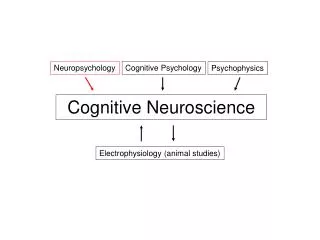
Fundamentals of Neuroscience Neuroimaging in Cognitive Neuroscience. James Danckert PAS 4040 jdancker@watarts.ca. Functional Neuroimaging. Electrical activity Event-related potentials (ERP), visual evoked potentials (VEP) all derivative from EEG Stimulation

E N D
Fundamentals of NeuroscienceNeuroimaging in Cognitive Neuroscience James Danckert PAS 4040 jdancker@watarts.ca
Functional Neuroimaging • Electrical activity • Event-related potentials (ERP), visual evoked potentials (VEP) all derivative from EEG • Stimulation • Trans-cranial magnetic stimulation – single vs. rapid pulse TMS • Metabolism • Positron Emission Tomography (PET) and Blood Oxygenated Level Dependent (BOLD) functional MRI (fMRI)
EEG • Large populations of neurons firing produce electrical potentials that can be measured at the scalp • Signals are passively conducted through the skull and scalp and can be amplified and measured • Difference between reference (ground) and recording electrodes are measured to give the electrical potential – electroencephalogram (EEG)
ERPs and VEPs • EEG tends to record global brain activity • ERPs (and VEPs) are a special case of EEG • average EEG trace from a large number of trials • align signal to onset of a stimulus or response – hence event-related potential (ERP)
Pros and cons of ERPs. Pros • Good temporal resolution • Linked to specific physiological markers (e.g., N1, P3 etc. which in turn can be linked to known cognitive processes) Cons • Poor spatial resolution • Difficult to get at some brain regions (OFC, temporal cortex)
Transcranial Magnetic Stimulation (TMS) Thompson (1910) placed head between two coils and stimulated at ~ 42 Hz saw flashing lights – magnetophosphenes was probably stimulating the retina and not the visual cortex Cowey and Walsh, 2001
TMS • TMS applies a magnetic pulse to a certain brain region to temporarily modulate the function of that region
TMS the induced current in the tissue is in the opposite direction to that of the coil the intensity of the signal drops off towards the centre and outside of the coil circular coil induced current Cowey and Walsh, 2001
little or no change TMS maximum hyperpolarization the flow of the current must cross the axon to cause stimulation or interruption of function (N3 will not be stimulated) maximum depolarization Cowey and Walsh, 2001
Spatial extent of TMS spatial extent of induced electric field drops ~ 75% within 10 mm affects 600 mm2 of neural tissue
Rapid vs. Single Pulse TMS for single pulse TMS duration of stimulation = 1 msec, but affects motor cortex for up to 100 msec for rapid or repetitive pulse TMS stimuli are delivered in trains with frequencies from 1 to 25 Hz (1 – 25 times per second) duration of after-effects for rapid pulse TMS anywhere from msec to several seconds
Transcranial magnetic stimulation (TMS / rTMS) • excitatory or inhibitory reversible effects depending on site and parameters of stimulation (e.g. frequency of pulses) • -> facilitates or slows down cognitive process/behavior • when inhibitory, referred to as ‘virtual lesion technique’ • can give precise timing information (msec level) due to transient nature of effects • rTMS is beginning to be used as a treatment for depression (focus is on DLPFC)
TMS • Poor spatial localisation – how focal is the stimulation? • Can’t stimulate certain areas (e.g., temporal lobe) and can only stimulate cortical surface • Good temporal resolution • Can presumably disrupt individual processes within a task. • Distance effects – changed interactions due to stimulation • Can induce seizures (particularly rTMS)
Frameless stereotaxy and fMRI areas can be identified functionally and then used to position the coil in a TMS study using the frameless stereotaxy method Paus is attempting to directly combine fMRI and TMS – with TMS pulses delivered in between fMRI runs
Metabolic Imaging • Two main techniques – positron emission tomography (PET) and functional MRI (fMRI) • Activity in cells requires energy (oxygen and glucose) • Increased neural activity will lead to changes in cerebral blood volume (CBV), cerebral blood flow (CBF) and the rate of metabolism of glucose and oxygen (CRMGl and CRMO) • These changes in blood flow and metabolism can be measured using PET and fMRI
Positron Emission Tomography (PET) • Measures local changes in cerebral blood flow (CBF) or volume and can also be used to trace certain neurotransmitters (but can only do one of these at a time) • Radioactive isotopes are used as tracers • The isotopes rapidly decay emitting positrons • When the positrons collide with electrons two photons (or gamma rays) are emitted • The two photons travel in opposite directions allowing the location of the collision to be determined
PET and subtraction • Run two conditions – stimulation (e.g., look at visual images) vs. control (e.g., look at blank screen) • Measure the difference in activation between the two images (i.e., subtract control from stimulation) • This provides a picture of regional cerebral blood flow relative to visual stimulation.
Motion vs. colour. • Subject views coloured screen (left) vs. moving random black and white dots (right) • Both task activate early visual areas (V1 and V2) • Subtracting the two images reveals different brain areas for colour (V4) vs. motion (V5) processing
PET vs. fMRI • PET allows you to track multiple metabolic processes so long as the emitted photon can be detected – allows imaging of some neurotransmitters • PET is invasive – radioactive isotopes can only be administered (at experimental levels) every 4 – 5 years • fMRI has much greater spatial resolution (~ mms) • fMRI has greater temporal resolution – can detect activation to stimuli appearing for less than a second (PET is limited by the half life of the isotope used)
Magnet safety • very strong magnetic fields – even large and heavy objects can ‘fly’ into the magnet bore
Cerebral blood supply. • Capillaries • Y=80% at rest. • Y=90% during activation. • 8 mm diameter. • 40% blood volume of cortical tissue. • Primary site of O2 exchange with tissue. • Arterioles • Y=95% at rest. • Y=100% during activation. • 25 mm diameter. • <15% blood volume of cortical tissue. • Venules • Y=60% at rest. • Y=90% during activation. • 25-50 mm diameter. • 40% blood volume of cortical tissue. • Red blood cell • 6 mm wide and 1-2 mm thick. • Delivers O2 in form of oxyhemoglobin. Transit Time = 2-3 s
fMRI • Deoxyhaemoglobin is paramagnetic • When neural activity increases more oxygenated blood than is needed is delivered to the site • This leads to an imbalance in oxyhaemoglobin and deoxyhaemoglobin – more oxy than deoxy • fMRI is able to measure this difference due to the different magnetic properties of oxy and deoxyhaemoglobin
fMRI and BOLD • blood oxygenated level dependent (BOLD) signal is actually a complex combination of: • rate of glucose and oxygen metabolism • CBV • CBF • same subtraction logic used in PET is used in fMRI
colours colours motion rest rest rest rest fMRI – block design • fMRI (like PET) began examining brain activity using block designs
fMRI – event-related design • allows randomization of stimuli (not possible in PET)
fMRI – event-related design • BOLD response has a predictable form • In rapid event-related designs the signal to a given trial type is deconvolved using models of the BOLD response
red= 2 - 1 green= 3 - 2 Sync each trial response to start of trial Linearity of BOLD response Dale & Buckner, 1997 Linearity: “Do things really add up?” Not quite linear but good enough !
Fixed vs. Random Intervals If trials are jittered, ITI power Source: Burock et al., 1998
fMRI spatial resolution • images can be co-registered to the subject’s own brain (not an average brain as in PET) PET fMRI
fMRI and topologies • Using fMRI to “map” different brain functions Penfield’s maps Servos et al., 1998 red = wrist; orange = shoulder
EXPANDING RINGS ROTATING WEDGES Retintopy • 8 Hz flicker (checks reverse contrast 8X/sec) • good stimulus for driving visual areas • subjects must maintain fixation (on red dot) Source: Jody Culham
EXPECTED RESPONSE PROFILE OF AREA RESPONDING TO STIMULUS To analyze retinotopic data: Analyze the data with a set of functions with the same profile but different phase offsets. For any voxels that show a significant response to any of the functions, color code the activation by the phase offset that yielded maximum activation (e.g., maximum response to foveal stimulus = red, maximum response to peripheral stimulus = pink) time = 0 time = 20 sec time = 40 sec 0 20 40 60 STIMULUS time = 60 sec TIME Source: Jody Culham
Retintopy: Eccentricity calcarine sulcus left occipital lobe right occipital lobe • foveal area represented at occipital pole • peripheral regions represented more anteriorly
Retinotopy Source: Sereno et al., 1995
Audition: Tonotopy Sylvian fissure temporal lobe cochlea Other Sensory “-topies”
Saccadotopy • delayed saccades • move saccadic target systematically around the clock Source: Sereno et al., 2001 http://kamares.ucsd.edu/~sereno/LIP/both-closeup+stim.mpg Marty Sereno’s web page
Finding the human homologue of monkey area X! • recent research has used monkey neurophys to guide fMRI in humans Dukelow et al. 2001
Problems with the search for homologues • Absence of activation doesn’t mean the absence of function • Presence of activation doesn’t imply sole locus of function • But our brains are different! • Confirmatory hypotheses Dukelow et al. 2001
fMRI and diagnosis • fMRI is starting to be used in patients with epilepsy • one goal is to use this as a tool to localise language, memory etc. prior to surgery • another goal would be to use fMRI to study the propogation of seizures • in stroke patients fMRI can be used to chart recovery of function
Left Right Patient SP – congenital porencephalic cyst
sequential tapping alternating tapping motor strip SP - motor strip
sequential tapping alternating tapping somatosensory strip SP – somatosensory strip
sequential tapping alternating tapping superior parietal 6 5 e g n 4 a h 3 c l a 2 n g i 1 s % 0 -1 images e 6.0 g n a 4.0 h c 2.0 l a n 0.0 g i s % -2.0 1 21 41 images
name animals Broca’s area? name objects non-word sounds (‘ba’) 2 e g n a 1 h c l a 0 n g i s -1 % 1 21 41 images
name animals left occipital name objects non-word sounds (‘ba’) 2 e g n a 1 h c l a 0 n g i s -1 % 1 21 41 images