Download
1 / 14
150 likes | 400 Vues
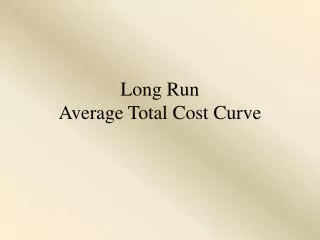
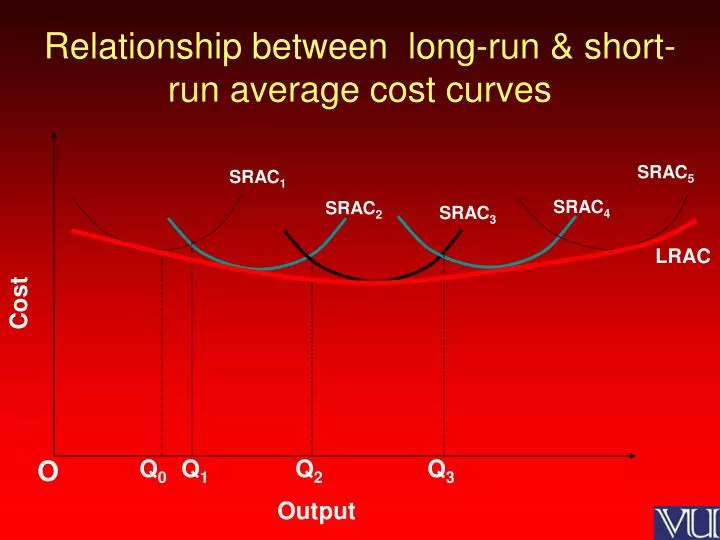
Relationship between long-run & short-run average cost curves. SRAC 5. SRAC 1. SRAC 4. SRAC 2. SRAC 3. LRAC. Cost. O. Q 0. Q 1. Q 2. Q 3. Output. Deriving a firm’s AR & MR curves: ‘price-taking’ firm. (a) The market. (b) The firm. P. P. TR at Q = 800. S. AR,MR (Rs).

E N D
Relationship between long-run & short-run average cost curves SRAC5 SRAC1 SRAC4 SRAC2 SRAC3 LRAC Cost O Q0 Q1 Q2 Q3 Output
Deriving a firm’s AR & MR curves: ‘price-taking’ firm (a) The market (b) The firm P P TR at Q = 800 S AR,MR (Rs) TR at Q = 400 D = AR = MR 5 5 D Q O Q O 200 400 600 800 1000 1200 1m 2m 3m m = millions
TR curve TR TR 4000 2000 Q O 400 800
Revenue of a ‘price-making’ firm facing a downward sloping demand curve 6 4 2 0 -2 -4
The market Rs Crores S S` P1 P2 D O Q1 Q2 Q
Revenue of a ‘price-making’ firm facing a downward sloping demand curve 6 4 2 0 -2 -4
elastic r Inelastic AR , MR Rs. Crores AR X Q MR
Total revenue for a firm facing a downward sloping demand curve Є = 1 Є > 1 Є < 1 TR 1 3 5 7
Total revenue and total cost approach to profit maximization
Scale on x axis Smooth curves π = Vertical distance between the TC & TR TR, TC TC MAX π = 18 – 14 = 4 18 TR 14 Q T π
TABLE 4 8 2 6 2 4 4 2 7 0 11 -2 20 -4
MC MR > MC MC, MR e MR < MC Q Q* MR
MC TR = OKLQ* Costs, revenue AC K L AR = 6 F T AC= 42/3 AR Q Q* Π = KLTF TC = OQTF MR
Loss minimizing output Costs, revenue MC AC AC Loss AR AR Q O Q* MR