Download
1 / 30
300 likes | 433 Vues
Scales of Measurement. Nominal classification labels mutually exclusive exhaustive different in kind, not degree. Scales of Measurement. Ordinal rank ordering numbers reflect “greater than” only intraindividual hierarchies NOT interindividual comparisons.

E N D
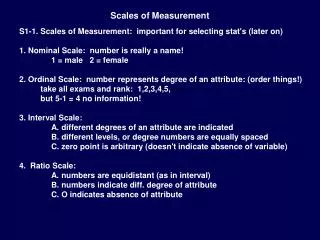
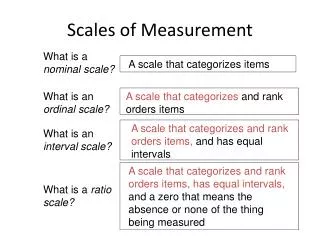
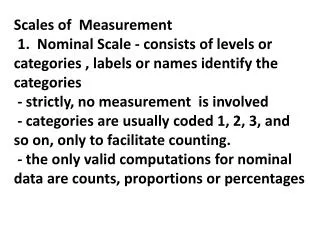
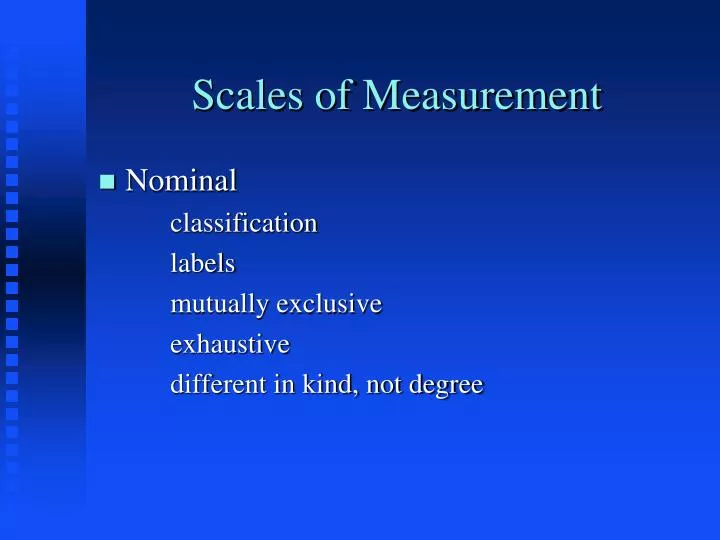
Scales of Measurement • Nominal classification labels mutually exclusive exhaustive different in kind, not degree
Scales of Measurement • Ordinal rank ordering numbers reflect “greater than” only intraindividual hierarchies NOT interindividual comparisons
Scales of Measurement • Interval equal units on scale scale is arbitrary no 0 point meaningful differences between scores
Scales of Measurement • Ratio true 0 can be determined
Contributions of each scale • Nominal • creates the group • Ordinal • creates rank (place) in group • Interval • relative place in group • Ratio • comparative relationship
Graphing data • X Axis horizontal abscissa independent variable
Y Axis vertical ordinate dependent variable
Types of Graphs • Bar graph qualitative or quantitative data nominal or ordinal scales categories on x axis, frequencies on y discrete variables not continuous not joined
Types of Graphs • Histogram quantitative data continuous (interval or ratio) scales
Types of Graphs • Frequency polygon quantitative data continuous scales based on histogram data use midpoint of range for interval lines joined
Measures of Central Tendency • Mean • Median • Mode
Measures of Variability • Range • Standard Deviation
Assumptions of Normal Distribution(Gaussian) • The underlying variable is continuous • The range of values is unbounded • The distribution is symmetrical • The distribution is unimodal • May be defined entirely by the mean and standard deviation
Terms of distributions • Kurtosis • Modal • Skewedness
Linear transformations • Expresses raw score in different units • takes into account more information • allows comparisons between tests
Linear transformations • Standard Deviations + or - 1 to 3 • z score 0 = mean, - 1 sd = -1 z, 1 sd = 1 z • T scores • removes negatives • removes fractions • 0 z = 50 T
Example T = (z x 10) + 50 If z = 1.3 T = (1.3 x 10) +50 = 63
Example T = (z x 10) + 50 If z = -1.9 T = (-1.9 x 10) +50 = 31
Chapter 3 - assignment • Which scale is used for your measure? • Is it appropriate? Are there alternates? • How will you graph the data from your measure?