Download
1 / 43
430 likes | 623 Vues
DEVELOPMENTOF IRRIGATION WATER DISTRIBUTION DECISION SUPPORT TOOL FOR MWEA IRRIGATION SCHEME. Mohammed Abdullahi (PhD) -Technical University of Kenya Benedict P.O Owilla -MIAD Dennis Okinyi -MIAD . Content . Background Objectives Research Methodology Reconnaissance Survey Results

E N D
DEVELOPMENTOF IRRIGATION WATER DISTRIBUTION DECISION SUPPORT TOOL FOR MWEA IRRIGATION SCHEME Mohammed Abdullahi (PhD) -Technical University of Kenya Benedict P.O Owilla-MIAD Dennis Okinyi -MIAD
Content • Background • Objectives • Research Methodology • Reconnaissance Survey Results • Irrigated Area Mapping Using LANDSAT • Water Demand Calculation Module • Remaining work
Background • In an effort to increase food production and create employment, the government has embarked on a programme to • develop new irrigation scheme, • expand and/or rehabilitate the old ones.
Scarcity of Water Resources • There is increasing competition for the scarce water resources by various sectors in the country notably between agriculture, industrial and municipal. • With the expansion of irrigation schemes competition within the agriculture sector has intensified hence the need to improve water productivity
Large scale irrigation schemes typically suffer from unequal distribution of irrigation water • unreliable deliveries of water due to either lack of a distribution plan or • difficulties in implementing one where available.
In 2007, the Water Resources Management Authority introduced charges for water use in the agricultural sector, • this meant that each scheme will pay for the amount abstracted/pumped irrespective of the irrigation efficiencies. • Thus there is great incentive to improve the water use efficiencies since this will translate to lower charges and hence savings for the farmers.
Irrigation infrastructure in Mwea Irrigation Scheme has been rehabilitated by the National Irrigation Board in the last few years • improved conveyance efficiencies • the next critical step in improving the overall scheme efficiency is to improve the decision making process in water distribution management • this tool goes a long in aiding the achievement of this goal
The Irrigation Water Distribution Support tool will enable staff and farmers to understand • the scheme water requirement at various stages in the growing season, • the available water resources • and the best way to distribute it.
OBJECTIVES • Determine the irrigated area for the Mwea Irrigation Scheme using Remote Sensing • Determine the seasonal irrigation water requirement for the Mwea Scheme • Develop a simple yet versatile irrigation water distribution support tool for each scheme that links demand to supply • Select and calibrate water measurement facilities to be used together with the tool developed above.
Irrigation Typology Module Data Collection and reconnaissance survey Remote Sensing data analysis (Irrigated area) Water Demand Calculation Module Water Resources Assessment Module Irrigation Water Distribution Module Legend Main Module Reporting Module Flowchart of Development of Irrigation Water Distribution Support Tool Methodology
Meteorological and River Discharge Data collected • Scheme Main, Branch canals, intake points mapped • Lined and unlined canal distance quantified • Number and condition of water measuring facilities assessed
The Irrigation command area is critical to calculating Scheme diversion requirement • The Mwea Irrigation Scheme has undergone expansion since late 1990’s • Irrigated area keeps fluctuating seasonaly due to availability of irrigation water among other factors
Determination of Irrigated Area -The LANDSAT offers an inexpensive and relatively accurate method for determining the irrigated area. • It has a spatial resolution of 30m and temporal resolution of about a month • Visual analysis of LANDSAT scenes between 2000 and 2013 showed that 2013 had the biggest irrigated area.
Two LANDSAT 8 Scenes for 2013 Short Rain Season were available just before the rainy season started, Late September and Late October. Late October (30th October) was selected since Most of the scheme were cropped and easily identifiable methodology
There are up to 11 bands in each scene, but of importance to this exercise is Band 4 (Red), and Band 5 (Near Infra red) . In order to bring out a good contrast in the vegetative index the division of band 5 over four is used(Konduris et al, 1998). Next since the Landsat scene is wide the area of interest (Mwea) and its environ is clipped
Using an colour enhanced scene for October 30th, manual digitization of the irrigated units boundary was done since the automatic digitization didn’t produce clear boundaries. Manually produced units were named Area of each unit calculated using GIS software
Gross Areas Using GIS software the areas the digitized polygons were calculated to give the gross areas (includes on farm infrastructure such as roads and canals Net Irrigated areas The roads & Canals were estimated at 6% as explained in the next slides. This was deducted from the gross areas to give net area Calculation of irrigated areas
FIELD MEASUREMENTS NB: 1. Length is an average of at least four measurements at different places. 2. Middle (bare section) of road, AV = 6.2 m
Causes of Area Differences This differences may be as a result of: -Wrong unit boundary, -Underestimation of official area: New extensions not accounted for.To be confirmed during “ground truthing”
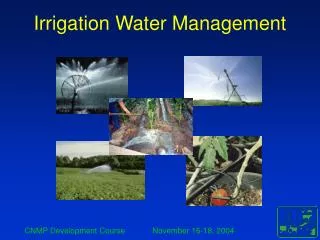
Data Needs for this Module • Irrigated area under at each water measuring structure (Check points) • Water requirement components • Puddling/rotavation water requirement • ET • Field Losses • Canal/Section losses • Other parameters (no of tractors & rotavation rate…)
Irrigated area • The water distribution calculation sheet picks up the irrigated area under each point from the cropping plan using lookup function =IF('Cropping Plan'!$D$4<Water_Requirement_Check_Points!$A8, IF('CroppingPlan'!$F$4>Water_Requirement_Check_Points!$A8, 'Cropping Plan'!$C$4,0),0)
Water requirement components • ET-Calculated using PENMAN Montheith and historical meteorology data • Rotavation requirement 250mm (Mohammed & Tanaka 1995) • Field Losses 2mm (Van Gessel 1980, Mohammed & Tanaka 1997) • Section/canal losses 0.4mm (Mohammed & Tanaka 1995)
Remaining Work • Ground truthing of Landsat irrigated area maps • Development of Remaining modules and documentation • Testing, Training and Deployment