Download
1 / 55
550 likes | 998 Vues
Assessing Child Growth Using the Body Mass Index (BMI)-for-age Growth Charts: A Training for Health Care Providers. Adapted by the CHDP Bay Area Nutrition Subcommittee (BANS) from Centers for Disease Control and Prevention National Center for Chronic Disease Prevention and Health Promotion

E N D
Assessing Child Growth Using the Body Mass Index (BMI)-for-age Growth Charts: A Training for Health Care Providers Adapted by the CHDP Bay Area Nutrition Subcommittee (BANS) from Centers for Disease Control and Prevention National Center for Chronic Disease Prevention and Health Promotion Division of Nutrition and Physical Activity Maternal and Child Nutrition Branch March 2006
BMI-for-age Growth Chart is: • considered standard practice by the American Academy of Pediatrics. • now required as part of the well-child exam for children ages 2 through 19 by the Child Health and Disability Prevention (CHDP) Program.
Training Objectives • Understand BMI and how it is useful to screen for normal growth • Learn how to plot BMI on the BMI-for-age growth charts • Learn how to assess a child’s growth using BMI-for-age growth charts for early identification of childhood overweight
No Data <10% 10%–14% Obesity Trends* Among U.S. AdultsBRFSS, 1985 (*BMI ≥30, or ~ 30 lbs overweight for 5’ 4” person)
No Data <10% 10%–14% Obesity Trends* Among U.S. AdultsBRFSS, 1986 (*BMI ≥30, or ~ 30 lbs overweight for 5’ 4” person)
No Data <10% 10%–14% Obesity Trends* Among U.S. AdultsBRFSS, 1987 (*BMI ≥30, or ~ 30 lbs overweight for 5’ 4” person)
No Data <10% 10%–14% Obesity Trends* Among U.S. AdultsBRFSS, 1988 (*BMI ≥30, or ~ 30 lbs overweight for 5’ 4” person)
No Data <10% 10%–14% Obesity Trends* Among U.S. AdultsBRFSS, 1989 (*BMI ≥30, or ~ 30 lbs overweight for 5’ 4” person)
No Data <10% 10%–14% Obesity Trends* Among U.S. AdultsBRFSS, 1990 (*BMI ≥30, or ~ 30 lbs overweight for 5’ 4” person)
No Data <10% 10%–14% 15%–19% Obesity Trends* Among U.S. AdultsBRFSS, 1991 (*BMI ≥30, or ~ 30 lbs overweight for 5’ 4” person)
No Data <10% 10%–14% 15%–19% Obesity Trends* Among U.S. AdultsBRFSS, 1992 (*BMI ≥30, or ~ 30 lbs overweight for 5’ 4” person)
No Data <10% 10%–14% 15%–19% Obesity Trends* Among U.S. AdultsBRFSS, 1993 (*BMI ≥30, or ~ 30 lbs overweight for 5’ 4” person)
No Data <10% 10%–14% 15%–19% Obesity Trends* Among U.S. AdultsBRFSS, 1994 (*BMI ≥30, or ~ 30 lbs overweight for 5’ 4” person)
No Data <10% 10%–14% 15%–19% Obesity Trends* Among U.S. AdultsBRFSS, 1995 (*BMI ≥30, or ~ 30 lbs overweight for 5’ 4” person)
No Data <10% 10%–14% 15%–19% Obesity Trends* Among U.S. AdultsBRFSS, 1996 (*BMI ≥30, or ~ 30 lbs overweight for 5’ 4” person)
No Data <10% 10%–14% 15%–19% ≥20 Obesity Trends* Among U.S. AdultsBRFSS, 1997 (*BMI ≥30, or ~ 30 lbs overweight for 5’ 4” person)
No Data <10% 10%–14% 15%–19% ≥20 Obesity Trends* Among U.S. AdultsBRFSS, 1998 (*BMI ≥30, or ~ 30 lbs overweight for 5’ 4” person)
No Data <10% 10%–14% 15%–19% ≥20 Obesity Trends* Among U.S. AdultsBRFSS, 1999 (*BMI ≥30, or ~ 30 lbs overweight for 5’ 4” person)
No Data <10% 10%–14% 15%–19% ≥20 Obesity Trends* Among U.S. AdultsBRFSS, 2000 (*BMI ≥30, or ~ 30 lbs overweight for 5’ 4” person)
Obesity Trends* Among U.S. AdultsBRFSS, 2001 (*BMI ≥30, or ~ 30 lbs overweight for 5’ 4” person) No Data <10% 10%–14% 15%–19% 20%–24% ≥25%
Obesity Trends* Among U.S. AdultsBRFSS, 2002 (*BMI ≥30, or ~ 30 lbs overweight for 5’ 4” person) (*BMI 30, or ~ 30 lbs overweight for 5’4” person) No Data <10% 10%–14% 15%–19% 20%–24% ≥25%
Obesity* Trends Among U.S. AdultsBRFSS, 2003 (*BMI ≥30, or ~ 30 lbs overweight for 5’ 4” person) No Data <10% 10%–14% 15%–19% 20%–24% ≥25%
Pediatric Nutrition Surveillance System (PedNSS) Growth Statistics forCity and County of San Francisco 2004BMI for age > 95% for Children 2-4 Years All Races 17.90% not enough data
Pediatric Nutrition Surveillance System (PedNSS) Growth Statistics forCity and County of San Francisco 2004BMI for age > 95% for Children 5-19 Years All Races 19.20% White 17.90%
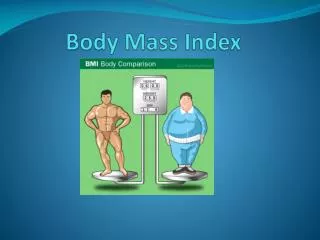
What is BMI? • A number that compares a child’s weight to her height • Body Mass Index (BMI) = Weight (kg) / Height (m)² • BMI is an effective SCREENING tool; alone it is nota diagnostic tool
BMI is Not the Same for Adults and Children • Adult BMI is evaluated by use of cut-off numbers; for example BMI >30 is indicative of adult obesity • There are no BMI cut-off numbers for children. The BMI number must be plotted on the BMI-for-age growth chart • The BMI for children is useful only when it is plotted on the “BMI-for-age Growth Chart”
For Children, BMI Changes with Age BMI BMI Example: 95th percentile tracking Age BMI 2 yrs 19.3 4 yrs 17.8 9 yrs 21.0 13 yrs 25.1 Boys: 2 to 20 years BMI BMI
Importance of Using BMI-for-age • Tracking tool for body size starting at age 2 years through adulthood • Only indicator that examines weight, stature AND age for a child on a single growth chart • Correlates with clinical risk factors for chronic disease including hyperlipidemia, elevated insulin, and high blood pressure
Using BMI-for-age Percentiles to Assess Risk > 95th percentile Overweight 85th to < 95thRisk of percentile overweight < 5th percentile Underweight
What is a Percentile? 50th Percentile 85th 5th 95th
CDC Standardized Growth Chart Formula to calculate BMI Percentiles (5th,10th,25th, 50th, 75th,85th,90th,95th) Published May 30, 2000
Using BMI-for-age Percentiles to Assess Risk > 95th percentile Overweight? 85th to < 95thRisk of percentile overweight? < 5th percentile Underweight? Growth acceleration or deceleration across 2 percentile lines
What is “Adiposity” Rebound (AR)? • A rebound or increase in BMI that occurs after it reaches its lowest point, usually between ages 4 to 6. • Normal pattern of growth • An early "adiposity" rebound, occurring before ages 4 to 6, is associated with obesity in adulthood. BMI
Normal “Adiposity” Rebound Early “Adiposity” Rebound BMI BMI
Steps to Plot BMI-for-age • Obtain accurate weight and height measurements • Select the appropriate growth chart • Record the data • Calculate BMI • Plot measurements • Interpret plotted measurements
BMI BMI Boys: 2 to 20 years BMI BMI • Obtain Accurate Weight and Height Measurements • Accurate Measurements are Critical 5 year old boy Weight: 43.5 lb Height: 43 in BMI= 16.5 BMI-for-age = 75-84th %tile Inaccurate height measurement: 42.5 in BMI=17 BMI-for-age = 85-94th %tile
2. Select the Appropriate Growth Chart • For ages birth to 36 months old: • “Length-for-age,” and “Weight-for-age” • “Weight-for-length,” and “Head Circumference-for-age” • For ages 2 to 20 years: • “Weight-for-age,” and “Stature-for-age” • Body Mass Index “BMI-for-age”
4. Calculate BMI English: Wt (lbs.) ÷Ht (in.) ÷ Ht (in.) x 703 Metric: Wt (kg.) ÷Ht (cm.) ÷ Ht (cm.) x 10,000
4. Calculate BMI • Use a Pediatric BMI Wheel
5. Plot Measurements 95th 85th 75th 50th BMI 5th Age
6. Interpret the BMI-for-age Chart • Need a series of BMI plots to determine the growth trend • If growth deviates from expected growth pattern, further assessment may be needed
Practice using “BMI-for-age” Growth Chart Pete (3 y) Gabriella (4 y) Liz (4 y) Photos from UC Berkeley Longitudinal Study, 1973
Please Plot Pete Perfectly Measurements for Pete: Age= 3 y 3 wks Weight= 41 lbs (18.6 kg) Height= 39.7 in (100.8 cm) Find BMI, plot, & interpret growth trend BMI= Wt ( lbs) ÷ Ht (in) ÷ Ht (in) x 703 Photo from UC Berkeley Longitudinal Study, 1973
BMI BMI Boys: 2 to 20 years BMI BMI Answers: Pete’s “BMI-for-age” BMI=18.3 • Interpretation: • BMI-for-age = >95th percentile • Overweight • Of 100 boys the same age, more than 95 have a lower BMI-for-age
Liz’s - BMI 17.7 Liz


![TRAINING FOR HEALTH CARE PROVIDERS [Date …Place …Event…Sponsor…Organizer]](https://cdn3.slideserve.com/5400789/training-for-health-care-providers-date-place-event-sponsor-organizer-dt.jpg)