Download

1 / 30
300 likes | 413 Vues
Community-Driven Adaptation. Iqbal Mohomed Department of Computer Science University of Toronto. Mobility and Adaptation. Content/applications target the desktop Resource rich environment Stable Mobile clients Limited resource (nw, power, screen size) Variable resources (Mbps to Kbps)

E N D
Community-Driven Adaptation Iqbal Mohomed Department of Computer Science University of Toronto
Mobility and Adaptation • Content/applications target the desktop • Resource rich environment • Stable • Mobile clients • Limited resource (nw, power, screen size) • Variable resources (Mbps to Kbps) • Adapt application/data to bridge gap
Manual/Static Adaptation • Publishers make available content for several classes of devices • e.g., HTML and WAP versions of Web page • Disadvantages: • High cost • Several copies • Maintaining consistency and coherence • Continuous effort to support new types of devices • You can never cover all possible versions! • In practice: • Only done for few high-traffic sites • Limited number of devices
Proxy Automatic/Dynamic Adaptation • Adapt content on-the-fly • Optimize for device type, user preferences, context, etc. • Typically done using proxies
Existing Approaches • Rule-based adaptation • Convert images larger than 10KB to JPEGs at 25% resolution • Constraint-based adaptation • Functions that relate "user happiness" to metrics (resolution, color depth, frame rate, latency) • Find point that meets all constrains and maximizes "happiness"
Limitations • Cannot have rules/constrains per-object per-device • Hard to define correlation between "user happiness" and metrics • In practice, rely on small sets rules/constrains • Based on broad generalizations • e.g., "typical image is viewable at resolution X" • Content agnostic
Problem • User does not care equally about all objects • The fidelity at which an object is useful depends a lot on the task and the object's content (semantics) 10% 10%
Problem • User does not care equally about all objects • The fidelity at which an object is useful depends a lot on the task and the object's content (semantics) 10% 50%
Observations • Computers have a really hard time judging if adapted content is good enough for a task • People can do this easily! Have the users decide how to adapt content!
Community-Driven Adaptation • System makes initial prediction as to how to adapt content (use rules and/or constrains) • Let user fix adaptation decisions • Feedback mechanism • System learns from user feedback • Improve adaptation prediction for future accesses
Server 1 Correct Server 2 Prediction How it Works Mobile Application Proxy
Draw Backs • User is integral part of adaptation loop • Significant burden on user • Iterative process is slow and frustrating • No way people are going to accept this for every access!
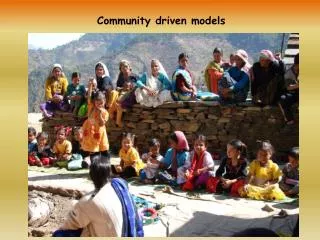
Hypothesis • User can be grouped into communities • Community members share adaptation requirements • Adapted content that is good for one member is likely to be good for other community members • By tracking a few users we can learn how to adapt content for the community as a whole
Research Questions • How good are CDA predictions? • What are good heuristics for learning how to adapt? • At what granularity should user accesses be tracked? (e.g. object, page, site, etc.) • How do we classify users into communities? • Does this classification change over time? • Types of adaptations supported by this technique • Fidelity, page layout, modality (text to voice, video to image) • UI • Good UI for working with adapted data • Effects of UI on quality of adaptation prediction
Performance Evaluation • Goal: Quantify extend to which CDA predictions meet users’ adaptation requirements • Approach: • Step 1: User study • Create trace that captures levels of adaptation that users consider appropriate for a given task/content • Step 2: Simulation • Compare rule-based and CDA predictions to values in trace
Simples Meaningful Scenario • 1 kind of adaptation • 1 data type • 1 adaptation method • 1 community • Fidelity • Images • Progressive JPEG compression • Same device • Laptop at 56Kbps • Same content • Same tasks
Proxy Prototype • Adaptation proxy • Transcode Web images into PJPEG • Split PJPEG into 10 slices • Client • Microsoft Internet Explorer 6.0 • IE plugging enables users to request fidelity refinements • Network between client and proxy • Simulated at 56Kbps
Proxy Prototype Operation • When loading page, provide just 1st slice • When user clicks on image • Provide additional slice • Reload image in IE • Add request to trace
Web Site and Tasks SiteTask Car show Find cars with license plates eStore Buy a PDA with a camera UofT Map Name of all buildings between two BA and Queen Subway Goal: finish task as fast as possible (minimize clicks) Traces capture minimum fidelity level that users’ consider to be sufficient for the task at hand.
Trace Characteristics • 77 different images • All tasks can be performed with images available at Fidelity 4 (3 clicks) • Average data loaded by users for all 3 tasks • 790 KB • 32 images are never clicked by any user
Metrics • Extra data • Measure of overshoot • Extra data sent beyond what was selected by user • Extra clicks • Measure of undershoot • Number of time users will have to click to raise fidelity level from prediction to what they required in trace
Results For same clicks, 90% less extra data
Results For same data, 40% less extra clicks
Summary • CDA adapt data tacking into account the content’s relationship to the user task • CDA outperforms rule-based adaptation • 90% less bandwidth wastage • 40% less extra clicks
Future Work • Comprehensive CDA evaluation • More bandwidths • More devices • Automatic classification of users into communities • Other data types • Stored video, audio • Other types of adaptation • Page layout, modality • UI • Good UI for working with adapted data • Effects of UI on quality of adaptation prediction Next 7 months 2nd & 3rd year
Research Team • Supervisor: Eyal de Lara • Grad. Students: Iqbal Mohomed Alvin Chin • Under. Students: Jim Cai Dennis Zhao iq@cs.toronto.edu www.cs.toronto.edu/~iq