Download
1 / 1
10 likes | 129 Vues
HOMOZENIZATION OF MONTHLY TEMPERATURE SERIES IN THE AREA OF THE AZORES – WINTER ANOMALIES DURING 20 th CENTURY. G. P. Meirelles a b ; J. Corte-Real c ; S. M. Leite d a Departamento de Ciências Tecnológicas e Desenvolvimento, University of Azores, P. O. Box 1422, 9501-801

E N D
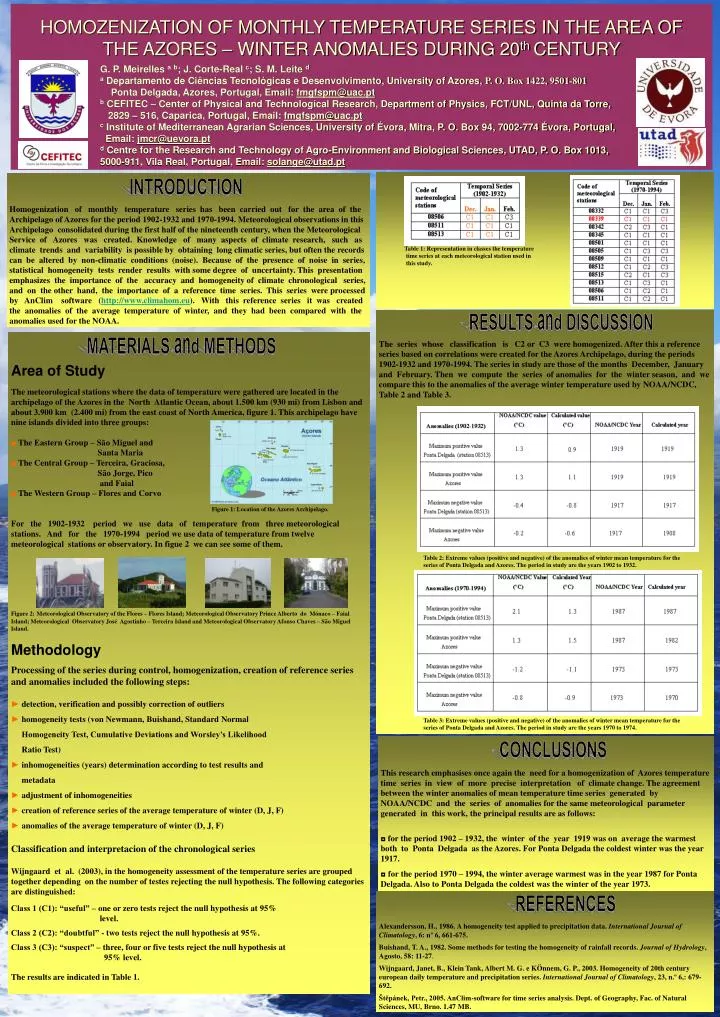
HOMOZENIZATION OF MONTHLY TEMPERATURE SERIES IN THE AREA OF THE AZORES – WINTER ANOMALIES DURING 20th CENTURY G. P. Meirelles ab; J. Corte-Real c; S. M. Leite d a Departamento de Ciências Tecnológicas e Desenvolvimento, University of Azores, P. O. Box 1422, 9501-801 Ponta Delgada, Azores, Portugal, Email: fmgfspm@uac.pt b CEFITEC – Center of Physical and Technological Research, Department of Physics, FCT/UNL, Quinta da Torre, 2829 – 516, Caparica, Portugal, Email: fmgfspm@uac.pt c Institute of Mediterranean Agrarian Sciences, University of Évora, Mitra, P. O. Box 94, 7002-774 Évora, Portugal, Email: jmcr@uevora.pt d Centre for the Research and Technology of Agro-Environment and Biological Sciences, UTAD, P. O. Box 1013, 5000-911, Vila Real, Portugal, Email: solange@utad.pt Table 1: Representation in classes the temperature time series at each meteorological station used in this study. Homogenization of monthly temperature series has been carried out for the area of the Archipelago of Azores for the period 1902-1932 and 1970-1994. Meteorological observations in this Archipelago consolidated during the first half of the nineteenth century, when the Meteorological Service of Azores was created. Knowledge of many aspects of climate research, such as climate trends and variability is possible by obtaining long climatic series, but often the records can be altered by non-climatic conditions (noise). Because of the presence of noise in series, statistical homogeneity tests render results with some degree of uncertainty. This presentation emphasizes the importance of the accuracy and homogeneity of climate chronological series, and on the other hand, the importance of a reference time series. This series were processed by AnClim software (http://www.climahom.eu). With this reference series it was created the anomalies of the average temperature of winter, and they had been compared with the anomalies used for the NOAA. INTRODUCTION The series whose classification is C2 or C3 were homogenized. After this a reference series based on correlations were created for the Azores Archipelago, during the periods 1902-1932 and 1970-1994. The series in studyare those of the months December, January and February. Then we compute the series of anomalies for the winter season, and we compare this to the anomalies of the average winter temperature used by NOAA/NCDC, Table 2 and Table 3. RESULTS and DISCUSSION Area of Study The meteorological stations where the data of temperature were gathered are located in the archipelago of the Azores in the North Atlantic Ocean, about 1.500 km (930 mi) from Lisbon and about 3.900 km (2.400 mi) from the east coast of North America, figure 1. This archipelago have nine islands divided into three groups: ■The Eastern Group – São Miguel and Santa Maria ■ The Central Group – Terceira, Graciosa, São Jorge, Pico and Faial ■ The Western Group – Flores and Corvo Figure 1: Location of the Azores Archipelago. For the 1902-1932 period we use data of temperature from three meteorological stations. And for the 1970-1994 period we use data of temperature from twelve meteorological stations or observatory. In figue 2 we can see some of them. Figure 2:Meteorological Observatory of the Flores – Flores Island; Meteorological Observatory Prince Alberto do Mónaco – Faial Island; Meteorological Observatory José Agostinho – Terceira Island and Meteorological Observatory Afonso Chaves – São Miguel Island. Methodology Processing of the series during control, homogenization, creation of reference series and anomalies included the following steps: ► detection, verification and possibly correction of outliers ► homogeneity tests (von Newmann, Buishand, Standard Normal Homogeneity Test, Cumulative Deviations and Worsley’s Likelihood Ratio Test) ► inhomogeneities (years)determination according to test results and metadata ► adjustment of inhomogeneities ► creation of reference series of the average temperature of winter (D, J, F) ► anomalies of the average temperature of winter (D, J, F) Classification and interpretacion of the chronological series Wijngaard et al. (2003), in the homogeneity assessment of the temperature series are grouped together depending on the number of testes rejecting the null hypothesis. The following categories are distinguished: Class 1 (C1): “useful” – one or zero tests reject the null hypothesis at 95% level. Class 2 (C2): “doubtful” - two tests reject the null hypothesis at 95%. Class 3 (C3): “suspect” – three, four or five tests reject the null hypothesis at 95% level. The results are indicated in Table 1. MATERIALS and METHODS Table 2: Extreme values (positive and negative) of the anomalies of winter mean temperature for the series of Ponta Delgada and Azores. The period in study are the years 1902 to 1932. Table 3: Extreme values (positive and negative) of the anomalies of winter mean temperature for the series of Ponta Delgada and Azores. The period in study are the years 1970 to 1974. This research emphasises once again the need for a homogenization of Azores temperature time series in view of more precise interpretation of climate change. The agreement between the winter anomalies of mean temperature time series generated by NOAA/NCDC and the series of anomalies for the same meteorological parameter generated in this work, the principal results are as follows: ◘ for the period 1902 – 1932, the winter of the year 1919 was on average the warmest both to Ponta Delgada as the Azores. For Ponta Delgada the coldest winter was the year 1917. ◘ for the period 1970 – 1994, the winter average warmest was in the year 1987 for Ponta Delgada. Also to Ponta Delgada the coldest was the winter of the year 1973. CONCLUSIONS Alexandersson, H., 1986. A homogeneity test applied to precipitation data. International Journal of Climatology, 6: nº 6, 661-675. Buishand, T. A., 1982. Some methods for testing the homogeneity of rainfall records. Journal of Hydrology, Agosto, 58: 11-27. Wijngaard, Janet, B., Klein Tank, Albert M. G. e KÖnnem, G. P., 2003. Homogeneity of 20th century european daily temperature and precipitation series. International Journal of Climatology, 23, n.º 6,: 679-692. Štěpánek, Petr., 2005. AnClim-software for time series analysis. Dept. of Geography, Fac. of Natural Sciences, MU, Brno. 1.47 MB. REFERENCES