Download
1 / 16
160 likes | 282 Vues
II.B. Counting the Poor and Malnourished. II.B.1. Counting the Poor II.B.2. Counting the Malnourished. II.B.1. COUNTING THE POOR. Poverty Headcount and Poverty Gap: A and B have same headcount; B has greater poverty gap. Human Development Index 2001. HDI Rank HDI GDP Rank - HDI Rank

E N D
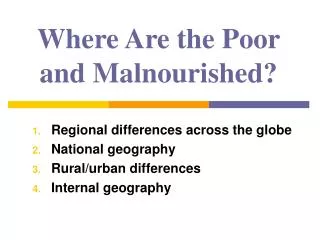
II.B. Counting the Poor and Malnourished II.B.1. Counting the Poor II.B.2. Counting the Malnourished
Poverty Headcount and Poverty Gap:A and B have same headcount; B has greater poverty gap
Human Development Index 2001 HDI RankHDIGDP Rank - HDI Rank • 1 Norway .944 +4 • 7 U.S. .937 -5 • 55 Mexico .800 +3 • 104 China .721 -2 • 127 India .590 -12 • 147 Uganda .489 +1 • 151 The Gambia .463 -20 • 174 Niger .292 -10 • 175 Sierra Leone .275 0
GDP Rank - HDI Rank • A negative number means that the country ranked worse (higher number) on Human Development Index than on Gross Domestic Product. • This could be interpreted as the country being less effective than average in how GDP improves human development because of, e.g, income inequality or policies.
HDI Changes 1975 - 2001 197519852001 Mexico .684 .748 .800 China .521 .591 .721 India .416 .481 .590 Uganda ….. .402 .489 Gambia .291 ….. .463 Niger .243 .254 .292 Sierra Leone ….. ….. .275
ALTERNATIVE POVERTY THRESHHOLDSSource: UW Institute for Research on Poverty
NOTES FOR ALTERNATIVE POVERTY THRESHHOLDS • The navy line (square markers) shows what U.S. poverty trends would look like after public benefits such as food stamps and housing subsidies are added to income and the various costs of working, such as taxes, child care, and medical expenses are subtracted. If all these income sources and expenses are taken into account, the incidence of poverty declines slightly. The blue line inverted triangular markers) shows poverty trends when out-of-pocket (OOP) medical expenses are ignored (the incidence of poverty decreases greatly); the green line (triangular markers) shows the trends when the Earned Income Credit, a federal earnings subsidy for low-income families, is ignored (the incidence of poverty increases somewhat) Source: UW Institute for Research on Poverty
All Races White Black Asian Hispanic (any race) Source:U.S. Census Bureau, http://www.census.gov/hhes/poverty/poverty02/table7.pdf (million)(%) 34.6 12.1 23.5 10.2 8.6 24.1 1.2 10.1 8.6 21.8 U.S. POPULATION BELOW POVERTY LEVEL BY RACE, 2002
U.S. POVERTY DATA AT:http://www.census.gov/hhes/www/ poverty.html