Download
1 / 40
400 likes | 570 Vues
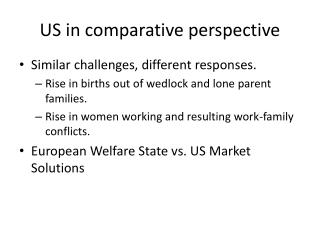
Child Poverty in Comparative Perspective. Paper for the seminar At Trinity College, Dublin 18 October 2004. Comparative data on child poverty is much improved. UNICEF Innocenti Centre studies Luxembourg Income Study European Community Household Panel OECD YET THERE ARE PROBLEMS.

E N D
Child Poverty in Comparative Perspective Paper for the seminar At Trinity College, Dublin 18 October 2004
Comparative data on child poverty is much improved • UNICEF Innocenti Centre studies • Luxembourg Income Study • European Community Household Panel • OECD • YET THERE ARE PROBLEMS
Problem 1: Timeliness • Latest LIS is circa 2000 (1996 for Ireland). • OECD 1993-95 • ECHP 2001 - 2000 income data • All too old to monitor impact of social and economic change and policy impacts now • And much change has been taking place since 2000 – ie UK and Ireland
Problem 2: Income • Income is only an indirect poverty indicator • Income unreliable in survey data • Underreporting by self employed • Ignorance of respondent • changes • Income invalid • expenditure a better measure of command over resources • what income has to buy varies between countries – ie NI and HBAI costs, value of free or subsidised service • Income only loosely related to outcomes, deprivation etc
Problem 3: Choice of equivalence • OECD scale derived from international negotiation 1/.7/.5 • Modified OECD based on anxiety it was too generous to children 1/.5/.3 • Square root of N just maths 1/.4/.3 • Whole process lacks science • Makes not much difference to poverty rates.
Problem 3: Choice of equivalence • OECD scale based on negotiation 1/.7/.5 • Modified OECD based on nothing 1/.5/.3 • Ditto square root of N 1/.4/.3 • Whole process lacks science • Makes not much difference to poverty rates. • Makes a big difference to the composition of the poor.
Problem 4: Income threshold is arbitrary • 60% median chosen by EU because with 50% too many farmers, self employed and students in the poor group • Sensitive to lumping
Problem 5: Relative measures in comparative research • 60% of national average or 60% of European average • 12% poor in Lux, 22% poor in Portugal if national • 2% poor in Lux, 47% poor in Portugal if European • Slovakia 8%, national 80% European • Need for a measure which is not absolute but less relative
Problem 6: Poverty gaps • Are high poverty rates and low gaps better or worse than low poverty rates and big gaps? • Relative to their rates: • Denmark, Finland, Ireland have low gaps • Lux, Netherlands, UK and Italy have high gaps
Problem 7: Episodes • Long term poverty worse than short term poverty
Problem 11: Relating inputs to outcomes • Very difficult because of • these different contexts • Out of date data • All the measurement problems • Detached discourses
Expenditure on family cash benefits and services in 1998 per child, $US purchasing power parities.
Expenditure on family cash benefits and services per capita child as % of per capita GDP
: Expenditure per child as percentage of expenditure per capita elderly, 1998
Conclusion so far • Quantitative analysis of child poverty has problems • Particularly difficult to rely on income only • Need for broader based measures of child well-being • International comparative project on child well-being, Health and Behaviour of School Children. • Need to develop more complex measures • Nordic Research Council project with Veli-Matti Ritakalio.
Background • ESRI work for the Irish poverty measure • UK adopted new ‘tiered’ child poverty measure • Poverty and Social Exclusion Survey analysis of overlaps (JSP 2003, 32,4) • Severe and persistent poverty in GB and NI • Three measures in ECHP – income , subjective, deprivation
Percentage children in families making ends meet with difficulty or great difficulty
ECHP deprivation questions • 1. Can the household afford keeping its home adequately warm? • 2. Can the household afford paying for a week's annual holiday away from home? • 3. Can the household afford replacing any worn-out furniture? • 4. Can the household afford buying new, rather than second-hand, clothes ? • 5. Can the household afford eating meat, chicken or fish every second day, if wanted? • 6. Can the household afford having friends or family for drink or meal at least once a month? • 7. Has the household been unable to pay scheduled rent for the accommodation during the past 12 months? • 8. Has the household been unable to pay scheduled mortgage payments during the past 12 months? • 9. Is there normally some money left to save (considering household’s income and expenses).
Conclusion • When measuring child poverty more than one is best