Download
1 / 23
230 likes | 309 Vues
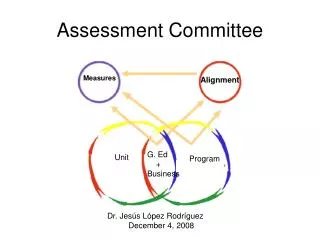
Exhibit 3.11 Data Report to Unit Assessment Committee. Spring 2008. AGENDA. UAS Document Update Review Data Trends and Patterns Candidate Proficiencies SPA Data (Marge) and Survey Data Ratings (Marge) Open-ended comments (Molly) Trends in SPA Recognition Reports (Molly)

E N D
Exhibit 3.11 Data Report to Unit Assessment Committee Spring 2008
AGENDA • UAS Document Update • Review Data Trends and Patterns • Candidate Proficiencies • SPA Data (Marge) and Survey Data • Ratings (Marge) • Open-ended comments (Molly) • Trends in SPA Recognition Reports (Molly) • Unit Operations • Survey Data • Ratings (Marge) • Open-ended comments (Molly) • AACTE Professional Data Systems (PEDS) (Molly) • Title II (Marge) • US News and World Report (Marge) • Discussion and Recommendations (Marge and UAC)
UAS DOCUMENT • Candidate Proficiencies – Table 1 • Internal - Focal Assessments • Table 2 - Internal – Surveys • Unit Operations – Table 2 • Internal • External • Table 3 – to be completed by UAC subcommittee for Fall 2008
FA Data Trends - Content • Candidate Proficiencies • MTEL Pass Rates – Table 1.3 • Consistent within the 95% - 100% range over time. • Additional Content Knowledge – Table 1.4 • Overall FA #2 data • Most teaching candidates – • proficiency at target or acceptable levels • Aavanced teacher education candidates, a • average cumulative undergraduate GPAs clustered around 3.28 level for candidates accepted into M.Ed and 3.49 for CAGS programs. • 99% of advanced candidates earned grades in the range of 3.0-4.0 which is the equivalent of acceptable and target. • Thus, the majority of advanced candidates either meet or exceed standard.
Survey Data Trends – Content • Tables 1.5, 1.6, 1.7 • 79% (F07) candidates report being very well or well prepared • 81% (F07) supervising practitioners report high ratings in preparation • 61% (F07) alumni themselves as having been very well or well prepared • Combined with the SPA data, • the unit’s candidates meet or exceed subject matter standards
FA Data Trends – PCK • FA #3 and FA#4 – Table 1.8 • Majority of programs report • candidates scoring at the Target level on FA#3 demonstrating that candidates have knowledge of instructional strategies that draw upon content. • FA#3 coupled with FA#4 (also high percentages of candidates at the Target level) • demonstrates that candidates have PCK and skills that help all students learn. • Advanced candidates grades in the coursework designated for field experiences 99% of candidates earned grades in the range of 3.0-4.0 which is the equivalent of acceptable and target. • The majority of candidates meet or exceed standard
Survey Data Trends – PCK • Table 1.9 • Candidates believe they are very well or well prepared in the utilization of a broad range of content related instructional strategies and meet standards for PCK (F07=63% & 78%) • (F07=70% & 74%) of supervising practitioners rated candidates very well or well prepared in PCK • Alumni respondents rated themselves as very well or well prepared in PCK (F07=61% & 53%) • There is a trend of improvement in respondents’ assessments of quality in pedagogical content knowledge preparation over time. • Overall, the survey results support the FA#3 and FA#4 results.
FA and Survey Data Trends – Technology • FA - Candidates cannot be recommended for licensure without receiving acceptable or target ratings on technology related standards - 100% meet technology requirements • Table 1.10 – Surveys show a trend of increased preparation over time. • In 2002, only 35% of candidates reported themselves as very well/well prepared in the use of technology in teaching. By 2007, that increased to 57% of candidates. • The percentage of supervising practitioners who are in a position to observe candidate use of technology during practicum has also increased from 52% in 2002 to 63% in Fall 2007. • Forty-six percent of 2007 alumni compared to 28% of 2002 alumni also indicated a trend of improvement in the preparation to use technology in teaching.
FA and Survey Data Trends - PPKS • Table 1.11 • 100% of candidates score at acceptable or target levels on PPA (required for licensure recommendation), however, scores are lower in classroom climate and operation standards • Table 1.12 and 1.13 • Survey data from supervising practitioners, candidates and alumni provide confirming evidence that candidates gain competency in the professional and pedagogical knowledge and skills expected by the unit. • Means for PPKS stay in the 3.5 – 4.5 range for most items. • Consistently lower mean ratings occur across groups, across time on the item related to candidate’s abilities to deal effectively with classroom management and student behavior • Paired with data the PPA data above, it is clear that there is room for growth in the area of classroom management.
FA Data Trends - Dispositions • Tables 1.8 & 1.11 • 99% to 100% of candidates meet or exceed dispositions standards. Ed Admin (71%) and School Psychology (100%) • Unit-wide dispositions inventory in pilot round
Survey Data Trends - Dispositions • Table 1.14 • Survey data support FA information. • Candidate and alumni data on disposition related items are similar and both groups rate their preparation lower than supervising practitioners rate it. • Candidates (F07=57%, 88% & 55%) • Alumni (F07=56%, 73% % 49%) • Supervising Practitioners (F07=72%, 93%, 65%) • The lowest ratings across all groups over time relate to the item “interacting positively with students’ families”. • This item aligns to MA Standards for Teachers E.5, Conceptual Framework.5 and INTASC.2, 3, and 8. • 57% of Candidates and 56% of alumni report having been prepared in sensitivity to and preparation for integrating linguistic and cultural diversity into the curriculum. • 72% of supervising practitioners see candidates as well or very well prepared in this area
FA and Survey Data Trends – Student Learning • Table 1.15 • The majority of the unit’s candidates meet the standards at either the target or acceptable levels. • Table 1.16 • Survey data match FA data. Majority of all groups rate preparation as well or very well in terms of assessment and facilitation of student learning • Candidates (F07=70%,65%,& 80%) • Supervising Practitioners (60%, 77%, & 91%) • Alumni (F07=63%, 63%, & 68%) • Means over the past three years are rather consistent in this area, although the general trend is that ratings are improving each year. • Table 1.17 • Advanced candidates’ grades in the range of 3.0-4.0 which is the equivalent of acceptable and target. • Table 1.18 OSP meets or exceeds standards • Table 1.18 – OSP meets or exceeds standards
Summary of Survey Open-Ended Comments Candidate Proficiencies Useful Aspects of Educator Licensure Program • People: Students/cohort, faculty, university supervisors, supervising practitioners • Other factors: courses, assessments, duration of practicum. Use of Technology in Instruction
SPA Recognition Reports – Trends Basic Stats
So What? • Many strengths across programs • Consistently weak items across programs • classroom management and dealing with student behavior • Interacting positively with students’ families • Alumni ratings in all categories are lower than the other two groups • What else? • Break!!!!!!!!!!!!!!!
Unit Operations – Survey Data • Advising – Candidates and Alumni • Means up and down over years • Dissatisfied with support in seeking employment • Practicum • General satisfaction overall • Dissatisfied somewhat with pre-practicum arrangements • Supervising Practitioners • Overall general satisfaction with arrangements, communication, meetings, evaluation • Continually somewhat dissatisfied with incentives/rewards received
Unit Operations – Survey Data Unit Operations • Positive: Faculty, supervising practitioner, program administration, practicum, program length. • Negative: Program administration, program information, advising, communication with faculty and administration.
Unit Operations Surveys • Dissatisfied with support in seeking employment • Dissatisfied somewhat with pre-practicum arrangements • Continually somewhat dissatisfied with incentives/rewards received (Sup Prac)
AACTE PEDS Trends Institutional Undergraduate and Graduate Enrollment – on the rise between 2003 and 2006. • Undergraduate students in Ed. Program: 0.22% of total institutional undergraduate enrollment. • Graduate students in Ed. Program: 16.8% of total institutional graduate enrollment (average). • Graduate students in Non Ed. Program: 0.44% of total institutional graduate enrollment (average).
AACTE PEDS Trends Professional Education Faculty
More External Data • Title II • Numbers of takers and passers somewhat consistent – above the 80% cut off • US News and World Report • Tied for 45th with 10 other universities (we moved up!)
Discussion and Recommendations • What needs to be done about the lower ratings on some items? • Classroom management • Working with families • Support for employment • Prepracticum arrangements • Incentives for supervising practitioners • Others? • How shall we handle the lower alumni ratings across items? • What else? • What next?