Download
1 / 30
300 likes | 428 Vues
Thundersnow Proximity Soundings. Patrick S. Market Atmospheric Science Program University of Missouri-Columbia. Introduction. Horizontal composite fields useful, but… Reveal otherwise typical snowstorms Many of the standard approaches to snow forecasting would apply

E N D
Thundersnow Proximity Soundings Patrick S. Market Atmospheric Science Program University of Missouri-Columbia
Introduction • Horizontal composite fields useful, but… • Reveal otherwise typical snowstorms • Many of the standard approaches to snow forecasting would apply • Need to distinguish what sets these convective snow storms apart from • Aspects of the sounding
Data and Approach • 12 proximity soundings were found • All associated with an extratropical cyclone • Assume • some feature (instability) makes these events unique, and • convection resulting from instability is the source of charge separation for lightning production
Data and Approach • Four events occurred at exact time and location of a sounding • Four events occurred at exact time of a sounding but were not at the exact location the sounding occurred • the location of thundersnow was within 90 nautical miles (167 km) of the sounding station • Four events occurred within 90 nmi of sounding station and the TS report occurred 0-3 h after balloon release
What we found – Part I • Thundersnow northeast of a cyclone center • NEC • N=4 • Potentially neutral, but • profiles rich in • moisture • forcing for ascent
What we found – Part II • Thundersnow northwest of a cyclone center • NWC • N=8 • Elevated layer of potential instability • Not deep, but exists in a region of • deep moisture • forcing for ascent
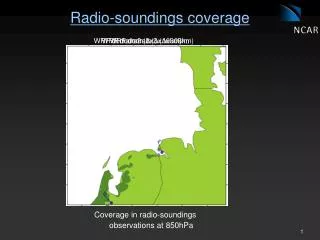
Previous work • Curran and Pearson (1971) • Found only 76 obs of TS (period - 2/68 TO 4/71) • Obs eliminated if they did not occur • Three hours before or after • 0000 or 1200 UTC, and • within 90 nmi of a rawinsonde station • Only 13 observations remained • All of these occurred east of the Rocky Mountains
Our results – Mean profiles • Mean profiles used raw data from 12 balloon flights • not fitted to a grid first • Proximity soundings show • mean temperature • mean dew point • mean wind speeds, and • median wind direction
Our results – Mean profiles • NWC mean proximity sounding • N=8 • NO CAPE present & NO PI present • However, moist-neutral LR from 700 mb to 550 mb • Also, Winds • veer from surface to 600 mb (WAA) • back from 600 mb to 400 mb (CAA) • veer from 400 mb to 200 mb (WAA)
Our results – Mean profiles • NEC mean proximity sounding • N=4 • NO CAPE present & NO PI present • Moist-neutral LR from 500 to 400 mb • Shallower than NWC • Higher that NWC • Deep WAA profile
Our results – Derived profiles • Mean derived (e.g., F ) profiles generated • Raob data objectively analyzed to a grid • horizontal grid spacing of 150 km • 50 mb vertical spacing. • Only TSSN at 0000, 0300, 1200, or 1500. • Location of the TSSN w.r.t. location of the sounding not a limiting factor as before • Samples now larger • NEC N=9 • NWC N=13
Our results – Derived profiles NWC cases • Potentially stable • Negative EPV not a recurrent theme • Weak values do manifest at ~600 mb
Our results – Derived profiles NEC cases • Potentially stable • Negative EPV not a recurrent theme • Weak values do manifest • Deeper layer than NWC cases • 700-500 mb
Our results – Typical profiles • Also based upon objectively analyzed data fitted to a grid, but… • Blind averages were not used here, as before • Cases examined individually to assess the existence of PI, and if present, where • While not a quantitative assessment of profiles, typical profiles reflect patterns seen most often.
Our results – Typical profiles NWC cases • 10 of 13 profiles revealed a PI layer somewhere • Two most common locations for PI • near the surface, usually 950 mb to 900 mb • usually late-fall or early spring • in the range of 700 mb to 600 mb • occurs throughout the year
Our results – Typical profiles NWC cases • Profiles speaks of a source of heat and moisture aloft • In a well-developed cyclone, warm moist air northwest of the surface low is most likely the result of the warm conveyer belt, especially the trowal
Our results – Typical profiles NEC cases • 5 of 9 profiles revealed at least one PI layer • near the surface, from 1000 mb to 950 mb • Second location of nearly neutral qe change was found higher in the atmosphere • ~650 mb to 600 mb • profile here is moist neutral
Conclusions • Not statistically significant, yet • Profiles would seem to support the hypothesis • potential instability related convection dominating in NWC thundersnow cases • potential symmetric instability related convection dominating in NEC cases