Download
1 / 23
250 likes | 390 Vues
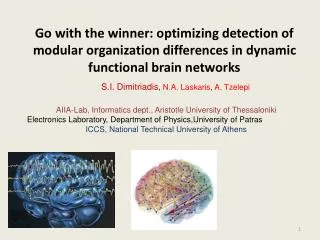
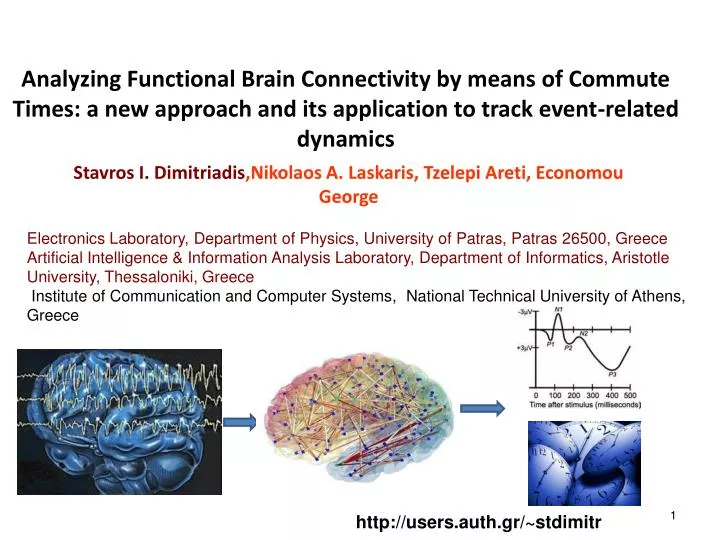
Analyzing Functional Brain Connectivity by means of Commute Times: a new approach and its application to track event-related dynamics . Stavros I. Dimitriadis , Nikolaos A. Laskaris, Tzelepi Areti , Economou George.

E N D
Analyzing Functional Brain Connectivity by means of Commute Times: a new approach and its application to track event-related dynamics Stavros I. Dimitriadis,Nikolaos A. Laskaris, TzelepiAreti, Economou George Electronics Laboratory, Department of Physics, University of Patras, Patras 26500, Greece Artificial Intelligence & Information Analysis Laboratory, Department of Informatics, Aristotle University, Thessaloniki, Greece Institute of Communication and Computer Systems, National Technical University of Athens, Greece http://users.auth.gr/~stdimitr
Outline Introduction -Multichannels EEG recordings -eye movement task -frequency range (4 – 10 Hz) -time varying connectivity analysis Methodology -PLV -Commute Times vs Shortest path length -Single trial approach - Cross –Validation scheme
Outline Outline of the Methodology Results Discussion
Analyzing connectivity in time – varying approach can unfold the “true dynamics” of brain functionality compared to static approach There is growing interest in studying the association of functional connectivity patterns with particular cognitive tasks. The ability of graphs to encapsulate relational data has been exploited in many related studies, where functional networks (sketched by different neural synchrony estimators) are characterized by a rich repertoire of graph-related metrics.
We introduce commute times (CTs) as an alternative way to capture the true interplay between the nodes of a functional connectivity graph (FCG). Commute time is a measure of the time taken for a random walk to set-out and return between a pair of nodes on a graph (Qiu & Hancock,2007). Its computation is considered here as a robust and accurate integration, over the FCG, of the individual pairwise measurements of functional coupling. To demonstrate the benefits from our approach, we attempted the characterization of time evolving connectivity patterns derived from EEG signals recorded while the subject was engaged in an eye-movement task.
Motivation We attempted to introduce a new way to capture the true interplay between the nodes of FCG. Employing Commute Times (CTs) to characterize connectivity, an improved detection of event-related dynamical changes is noticeable. CTsappear to be a promising technique for deriving temporal fingerprints of the brain’s dynamic functional organization.
Data acquisition:Resting state 7 subjects / 64 EEG electrodes Horizontal and Vertical EOG Trial duration: 5.5 seconds Multi trial analysis 2 conditions:Attentive/Passive Baseline period : 1 sec Appearance of flashing checkerboard at time 0 After 4 sec the disappearance of the central fixation cross indicated the “go” signal and subjects had to make a saccade towards the opposite side of the checkerboard (antisaccade ; attentive) or doing nothing (passive).
Filtering Using a zero-phase band-pass filter (3rd order Butterworth filter), signals were extracted within frequency range of 4 – 10 Hz Artifact Correction Working individually for each subband and using EEGLAB (Delorme & Makeig,2004), artifact reduction was performed using ICA -Components related to eye movementwere identified based on their scalp topography which includedfrontal sites and their temporal course which followed the EOGsignals. -Components reflecting cardiac activity were recognizedfrom the regular rythmic pattern in their time course widespreadin the corresponding ICA component.
Artifact Correction Muscle activity related ICs were identified based on statistical terms (the kurtosis of derived timecourses was higher than a predefined threshold, kurtthr=12), spectral characteristics (increased energy in the frequency range of 20 – 60 Hz) and topographies encompassing temporal brain areas (Delorme et al., 2007).
Constructing Functional Connectivity Graphs FCGswere constructed by adopting PLV estimator. Detecting Significant Couplings • Average approach • Based on a Rayleigh test for the uniformity of PLV values, we calculated the significance of each value • (Fisher, 1989) • significance is calculated as • To correct for multiple testing, the false discovery rate (FDR) method was adopted (Benjamini & Hochberg, 1995 ) • A threshold of significance was set such that the expected fraction of false positives was restricted to q<= 0.01.
Detecting Significant Couplings • Single trial approach • significant PLV values were determined after calculating PLV for surrogates derived by randomizing the order of trials in one of the channels of each pair (Lachaux et al., 2000) • Significance levels were then extracted from the z-scores of the difference between PLV values in the original and surrogate data. • Significance probabilities were corrected using the false discovery rate (FDR) method in order to correct for multiple comparisons • The expected fraction of false positives was restricted again to q<= 0.01.
Weighted shortest path length vs CTs • We constructed an artificial five-module graph • Scatter plot of Wspl with CTs From this plot it is clear that Commute Timevaries more smoothly than the shortest path length and has also a wider range of values.
Tracking dynamical changes in functional organization The relative change of Frobenious norm (Fn) of CT matrix in the attentive task was calculated, at every latency t, with respect to the corresponding matrix from the passive task To fully justify the merits of CTs, we replaced CT(t) timeseries with W(t) and Wspl(t)
Tracking dynamical changes in functional organization It is demonstrated that functional connectivity does change when attention is employed as early as 130 ms after stimulus onset. It is evident from Fig.4a,b that CTs facilitate the effortless and accurate detection of (task-induced) changes in functional organization.
Tracking dynamical changes in functional organization It is demonstrated that functional connectivity does change when attention is employed as early as 130 ms after stimulus onset. It is evident from Fig.5a,b that CTs facilitate the effortless and accurate detection of (task-induced) changes in functional organization. CTs improved the detection of event-related dynamical changes with respect to previous network descriptors (W & WSPL). In Fig.5 b) only CTs detected the functional connectivity changes related to VEP (Visual Evoked Potential)
Machine-Learning Validation In order to justify further the previous finding about the role of attention, we followed a machine learning methodology with the aim of showing that the patterning of functional connectivity carries enough information to distinguish between the attentive and passive responses Using the latency tmax of best discrimination, as derived form the ‘across trials’ computations and the identification of maximal difference in functional connectivity (eq.1), we extracted the single-trial instantiations of functional connectivity graphs. Each connectivity matrix was first transformed to an input-vector of dimensionality [64x 63] (#sensors x (#sensors -1)) .
Machine-Learning Validation The initial dimensionality of connectivity patterns was reduced via kernel-PCA (kPCA) (Schölkopf et al., 1999) The classification scheme employed was a linear SVM with the cost parameter C set as 10 (Schölkopf & Smola,2002 ) In order to achieve a reliable estimation of the generalization error, a 10-fold cross validation scheme was adopted. -Each subject’s trials were first split into 10 equal-sized subsets. -Then for every fold, the classification error was measured based on a classifier trained upon the data in the remaining 9 folds. -After cyclically repeating this train-and-test procedure, the overall estimate of classification performance was derived by averaging over the 10 folds.
Machine-Learning Validation Table 1. Classification performance regarding the task of discriminating attentive vs passive brain responses based on the single-trial functional-connectivity patterns. Left /Right column corresponds to trials in which the stimuli had appeared on the left/right.
Conclusions The suggested methodology incorporates CTs for tracking event-related functional-connectivity pattern Its demonstration was based on experimental data from a paradigm that both induced evoked responses and triggered decision making. The evoked responses consist of early and latecomponents -The former correspond to activation of the sensory cortex specific to each type of stimulus and the latter, to activation of the association cortex - That is, the former enable identification of the mechanism of simple sensory and the latter of higher functions. In the present study, we showed a functional organization of the network due to the late component of the VEP (~130 ms) (see Fig. 4a,5a) and especially in brain areas contralateral to the presentation of the visual-stimulus
Conclusions A study combining MEG-measurements with source reconstruction has recently advanced our knowledge about spatial/nonspatial attentionand its relation to visual and auditory stimuli (Poghosyan & Ioannides,2008 ) Spatial selective attention has been shown to influence the early sensory processing stages(Poghosyan & Ioannides,2008 ) Here it is important to stress that the effect of attentional modulation cannot be seen in the EEG-signals (see Fig2), but can be easily detected in the pattern of functional connectivity (Fig.4b,5b).
Conclusions We addressed two important problems in neuroimaging functional neuroscience and connectomics: -The first is the reliable estimation of information exchange among distinct brain areas by means of pairwise measurements of functional dependence based on the recorded signals. -The second is the detection of significant changes in time-evolving connectivity patterns and its association with neural processes underlying cognition. We demonstrated the benefits of Commute Times, an algorithmically tractable graph analytic approach that is well suited to weighted graphs and therefore directly applicable to real-valued connectivity data without the need for binarization Finally, the introduced analysis can be applied, as well, to connectivity patterns from well-localized brain activity (reconstructed EEG/MEG, fMRI, etc.).
References [1]Dimitriadis SI, Laskaris NA, Tsirka V, Vourkas M, Micheloyannis S (2010a) Tracking brain dynamics via time-dependent network analysis. J Neurosci Methods 193:145–155 [2] Jung, T. P., Humphries, C., Lee, T. W., Makeig, S., McKeown, M. J., et al. (1998). Extended ICA removes artifacts from electroencephalographic recordings. Advances in Neural Information Processing Systems, 10, 894-900. [3] Onton, J., Westerfield M., Townsend, J., & Makeig S. (2006). Imaging human EEG dynamics using independent component analysis. Neuroscience & Biobehavioral Reviews, 30, 808-822. [4] Delorme, A. & Makeig S. (2004). EEGLAB: an open source toolbox for analysis of single trial EEG dynamics. Journal of Neuroscience Methods, 134, 9-21. [5] N. I. Fisher, Statistical Analysis of Circular Data. Cambridge University Press, UK, 1989. [6] Y. Benjamini and Y. Hochberg, “Controlling the false discovery rate: a practical and powerful approach to multiple testing,” J. Roy. Stat. Soc. Ser. B (Methodol.) , vol.57,pp.289–300,1995. [7] J.P. Lachaux, E. Rodriguez, M. Le Van Quyen, A. Lutz, J. Martinerie and F.J. Varela, “Studying single-trials of phase synchronous activity in the brain,” Int. J. Bifurcat. Chaos, 10 (2000), pp. 2429–2439. [8] Schölkopf, A. Smola, and K.-R. M¨uller. Kernel principal component analysis. In B. Sch¨olkopf, C. Burges, and A. Smola, editors, MIT Press, Cambridge, MA, 1999, Advances in Kernel Methods — Support Vector Learning, 327 – 327-352. [9] B. Schölkopf and A. Smola, Learning with Kernels: Support Vector Machines,Regularization, Optimization, and Beyond. Cambridge, MA :MIT Press, 2002. [10] V.Poghosyan and A.A.Ioannides, “Attention modulates earliest responses in the primary auditory and visual cortices,” Neuron, vol.58, pp.802-813, 2008. [11]A. Delorme, M. Westerfield and S. Makeig, “Medial prefrontal theta bursts precede rapid motor responses during visual selective attention,” J Neurosci, vol.27, pp.11949-11959, 2007. [12]H. Qiu and E.R. Hancock, “Graph simplification and matching using commute times,”Pattern Recognition, vol.40, pp.2874-2889, 2007.