Download
1 / 87
910 likes | 1.27k Vues
Progress Monitoring Pennsylvania’s Seven-Step Process. Summer 2011 Capital Area Intermediate Unit Tanya Morret, Educational Consultant, CAIU. Essential Questions. What are the steps to monitoring student progress ? How do we use the Assessment Tools? Early Literacy Oral Reading Fluency

E N D
Progress Monitoring Pennsylvania’sSeven-Step Process Summer 2011 Capital Area Intermediate Unit Tanya Morret, Educational Consultant, CAIU
Essential Questions • What are the steps to monitoring student progress? • How do we use the Assessment Tools? • Early Literacy • Oral Reading Fluency • Comprehension • Writing • Early Numeracy • Computation • Concepts and Applications • How and when do we make instructional changes? • Graphing • Rate of Improvement
Assessment – It Begins Here • Four Types of Assessments: • Summative • Benchmark • Diagnostic • Formative
Summative • PSSA/PASA, Terra Nova, CAT • Determines the amount of yearly progress the student is making within their current grade level standards/essential learning in comparison to a normative group • Administered annually • Research has shown that, despite learning discrepancies, students can make as much as a 20+ point difference on these tests if they are provided with effective instruction
Benchmark • 4Sight, DIBELS, Math Benchmarks, District or Regional Assessments • Is a predictor of how well students are likely to perform on the annual, state-wide assessment • Provides the school/teacher with information regarding deficit skills/areas to inform instructional planning and decision-making • Administered 3-4 times per year
Diagnostic • Woodcock-Johnson, DRA, Etc. • Determines a student’s current functioning level and where instruction should begin. • May identify deficit skill areas for remedial instruction • Provides direction as to what level/skills/curriculum is most appropriate • Administered 1 time per year, usually immediately prior to a student’s IEP/ER or at the beginning of the school year
Formative • Progress Monitoring Assessments, Checklists, Curriculum Based Assessments, etc. • Quick assessment of current skills • Provides the teacher with the opportunity to make on-the-spot adjustments • Administered on a regularly scheduled basis throughout the school year (daily, weekly, bimonthly)
Essential Questions • What are the steps to monitoring student progress? • How do we use the Assessment Tools? • Early Literacy • Oral Reading Fluency • Comprehension • Writing • Early Numeracy • Computation • Concepts and Applications • How and when do we make instructional changes? • Graphing • Rate of Improvement
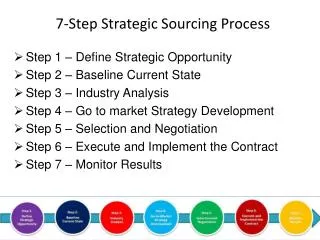
The Seven-Step Process 1. Measurable Annual Goals 2. Data Collection Decisions 3. Data Collection Tools and Schedule 4. Representing the Data 5. Evaluation of Data 6. Instructional Adjustments 7. Communicating Progress
Progress Monitoring Cycle • Initial Assessment: • Direct Intervention • Historical Data • Standardized Assessments • Diagnostic Assessment • Curriculum-Based Assessment • Parent Input • Design Instruction: • Develop Goals (& Objectives) • Identify SDI • Alignment to General Curriculum • Instructional Grouping & Scheduling • Identify Progress Monitoring • Ongoing Evaluation: • Evaluate Effectiveness of Instruction • Use Data to Make Decisions & • Assess Progress • Adjust Goals (& Objectives) • Adjust SDI & Instruction As Needed • Report to Parents • Deliver Instruction: • Deliver Instruction According to Goals (& • Objectives) Using SDI • Collect Data on Progress • Monitor Student Response & Feedback
Step 1: Measurable Annual Goals • Components of Measurable Annual Goals: • Condition • Student’s Name • Clearly defined Behavior or Skill • Performance Criteria Remember, CNBC !
Goals in General Education? • Do we write formal goals in general education? Should we? • What is the goal in general education? • How does a Universal Screening/ Benchmark Assessment help us identify students at risk (and therefore in need of closer monitoring)?
Research tells us that… Monitoring student progress alone can (and does) Increase student achievement!
Step 2:Data Collection Decisions • Type of data to be collected • Frequency or rate • Percentage or accuracy • Fluency • Duration • Setting(s) and/or Situation(s) where data will be collected • Person(s) responsible for data collection • Latency • Quality • Level of assistance If these decisions are not made at the beginning, the likelihood of data collection is greatly reduced.
Step 3:Data Collection Tools and Schedule • What tools will best measure the skill? • Curriculum based measures • Checklists/Rubrics/Rating Scales • Teacher-made tests (standardized) • How often will the data be collected? • Weekly • Every other week/Bimonthly • Monthly • Two times per week • Daily*
Step 3:Data Collection Tools and Schedule • How often will data be evaluated and with what rules? • 4 out of 6 points above or below expectation (aimline) • 3 consecutive points above or below expectations “Without the data, you’re just another person with an opinion.” A. Sunderville, 2003
Step 4:Representing the Data • Visual representation is ideal • Graphs (include aimline, data and trend line) • Bar graphs compare sets of values • Line graphs reveal trends over time • Tables • Charts • The data should stand alone • The data should be understandable to all
Graphing is Best Trendline Aimline Student Data WCPM Errors (optional)
Step 5:Evaluation of Data • Summarize student performance • Level of performance • What changes occur following intervention? • Slope of performance (Trend) • What is the rate of change? • Variability of performance • Up-and-down movement on the graph • Apply Decision Rules(keep rules constant) • Examples: 4 out of 6, 3 consecutive
Step 6:Instructional Adjustments Look for simple changes first before moving to more complex Do not abandon a goal before trying to change the components of instruction! • Consider changes in intervention strategies • Reinforcement type or schedule • Different methods • Different instructional groups • Frequency, intensity, duration • Students graphing their own data
Step 7:Communicating Progress • Communication is a two-way street • Home issues affect performance • Classroom and instructional issues affect performance • Communication with parents and team members should be ongoing • Weekly (regular) phone calls, team meetings • Communication books, data logs, email • Progress reports (including graphs) • Parent-teacher conferences
Summarizer 3-2-1 First Three Steps of Progress Monitoring Two data rules. One Question you still have
Essential Questions • What are the steps to monitoring student progress? • How do we use the Assessment Tools? • Early Literacy • Oral Reading Fluency • Comprehension • Writing • Early Numeracy • Computation • Concepts and Applications • How and when do we make instructional changes? • Graphing • Rate of Improvement
Practice with the tools
Measuring Literacy
Early Literacy Tools • Assessments available: • Phoneme Segmentation Fluency (PSF) Phonemic Awareness • Nonsense Word Fluency (NWF) Phonics
Phoneme Segmentation Fluency • Words orally presented to student. • Student segments words into parts. • Record each different, correctpart of the word. • Timed for 1 minute. • Established at 35 segments per minute. Recommended Schedule: One time per week
Tips for PSF • Pacing is everything • Keep your talk to a minimum • Do not add phrases such as… • “Good!” • “The next word is…” • Underline each different, correct part • Whole words = 0 points
PSF Example 3 points 0 points 1 point 3 points
Score Along • Listen to the presenter. • Score using the form in your packet
Nonsense Word Fluency • Non-words presented on a page for student. • Student may read word as a whole or read each sound in the word. • Underline each correct letter sound. • Record errors. • Timed for one minute. • Established at 50 letter sounds (CLS) per minute and15 words read correctly (WRC). Recommended Schedule: One time per week
Tips for NWF • Model segmentation of sounds and word reading before beginning assessment. • All vowel sounds are short. • The goal is word reading. If the student can decode the entire word, encourage him/her to do that. • Underline eachletter the student decodes accurately.
NWF Example 3 CLS ō 2 CLS 3 CLS 1WRC p ə 1 CLS
Score Along • Listen to the presenter. • Score using the form in your packet
Monitoring Reading and Writing • Assessments available: • Oral Reading Fluency (ORF) Fluency of Decoding • Maze Comprehension • AIMSWeb Comprehension Questions Comprehension • Passage or Story Retell Comprehension • Writing Sample Writing Fluency, CWS, Domain Scoring Guide
Measuring Oral Reading Fluency For most students: Oral reading and fluency go hand-in-hand Progress in comprehension can be monitored using Oral Reading Fluency Measures Fluency Comprehension
Measuring Oral Reading Fluency • Easy to administer • Quick although administered individually • Can be done by different examiners (if standard procedures followed) Recommended Schedule: One time per week
Measuring Oral Reading Fluency • Provides formative miscue analysis • Allows teachers to assess qualitative features • Allows for assessment of accuracy and fluency • Is predictive of future achievement • First grade outcomes are strongly related to third grade outcomes • Timed for one minute
Tips for ORF • Monitor at instructional level (90-94% accuracy) • You may read the title of the passage • Slash errors - add notes for errors • Remember to bracket ( ] ) after the last word read • To establish baseline, the student reads three passages • Record the median score.
Steps to Monitor ORF • Select a passage at the student’s instructional level. • Deliver a standard set of directions. • Set countdown timer for 1 minute. • Begin timing when student begins reading • Record errors as the student reads. • Bracket (]) after the last word read within the time limit.
ORF Example Going to Family Camp flavor pragram 14 30 43 49 61 73 88 94 106 120 134 137 My favorite part of family camp is the campfire program at the lake. We wait until the stars and moon are out. We walk down to the edge of the water where a big bonfire is going. We all snuggle together watching the flames because it’s cold after dark. The camp director leads everyone in songs. He plays the banjo. We sing “You are My Sunshine,” and “She’ll be Coming Around the Mountain.” Then he divides the group in two and we sing rounds like “Row, Row, Row Your Boat” and “Are You Sleeping?” Then we have stories and skits. The stories are usually tales about campers at family camp in previous years, and a funny or brave thing that they did. One story was about my older brother rescuing a cat. The skits are always silly. +ed ed gee bancho leds divide is ] 83 words read - 7 errors = 76 wcpm 76 wcpm ÷ 83 total words = 92% accuracy DIBELS 3RD Grade Passage
Characterize the Errors • Multi-syllabic words – favorite, program, waited • Endings – waited, divides • Vowels – program, leads • Consonant digraphs/trigraphs – edge, banjo
Qualitative Features • Dysfluent: Student is considered “some risk” for grade level (fall, winter benchmarks) • Word attack: Initial sound correct in all miscued words read (errors), self corrected some words • Pacing:Slowed down to read difficult or unfamiliar words • Prosody: Little expression, inflection; did not pause for end punctuation with consistency
ORF Example Ancient Egyptians Traveled to the New World ainsent (-ed) omit 13 27 40 53 66 77 92 103 113 121 133 147 The ancient Egyptians believed that once they died, they would go to a place called the New World. This New World was thought to be a wonderful place where people could live forever. Arriving in the New World was so important to the Egyptian people that they make great plans for this afterlife journey. One important plan was to build pyramids to be used as tombs. Another important plan was to preserve the body. The Egyptians believed that if the dead body decayed, the person’s spirit would die and be unable to reach the New World. They developed a process called embalming. This process turned dead bodies into mummies. Usually only the wealthy Egyptians were able to have their bodies mummified. The Egyptians believed that travel to the New World was difficult. They thought that the dead needed to have food and drink to make the journey sound out ĭ sound out sound out made sound out tah mbs Jow er ney SC pie ra mid pre serve sound out sprit im bal ming ] 103 words read - 11 errors = 92 wcpm 92 wcpm÷ 103 total words = 89% accuracy Six Minute Solution 7th Grade Passage
Characterize the Errors • Multi-syllabic words – ancient, believed, wonderful, arriving, important, afterlife, etc. • Endings – believed, arriving • Vowels – journey, pyramid, tombs • Prefix - embalming
Qualitative Features • Dysfluent: Rate is below basic for grade level • Word attack: Sounded out by syllables • Pacing:Slowed down to read difficult or unfamiliar words • Prosody: Little expression, inflection; paused for end punctuation • Automatically rereads words: Only becomes automatic after several exposures
Questions about Reading Fluency? • Foundation skills (LNF, PSF, NWF) • Oral Reading Fluency • Determining instructional level • Frequency of monitoring • Error analysis • Reporting present levels • Writing measurable goals
Measuring Reading Comprehension