Download
1 / 3
30 likes | 152 Vues
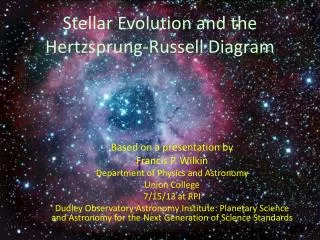
The H-R Diagram: roadmap for stellar understanding. No, it’s not Harvard-Radcliffe (sorry for the tiresome pun…), but Hertzsprung-Russell who charted the path for understanding the stars with a remarkably powerful way of looking at data… So what is the H-R diagram?

E N D
The H-R Diagram: roadmap for stellar understanding • No, it’s not Harvard-Radcliffe (sorry for the tiresome pun…), but Hertzsprung-Russell who charted the path for understanding the stars with a remarkably powerful way of looking at data… • So what is the H-R diagram? • A plot, with stars as the points, of apparent magnitude vs. color index (i.e., V vs. (B-V)), for stars at fixed distance, as in a stellar cluster • A plot, with stars as the points, of absolute magnitude vs. color index (i.e. MV vs. (B-V)), for any stars • A plot of stellar luminosity vs. temperature (i.e. L vs. T) which tells us that more luminous stars are hotter • A tool for understanding stellar evolution and our destiny Oct. 30, 2007
An example H-R diagram… • From your text (Fig. 17-15), a generic H-R diagram looks like when plotted as L vs. T (left). And by plotting lines of constant stellar radius (using Stefan-Boltzmann law), we see how the actual sizes (radii) of stars vary across the H-R diagram (right). Stars like our Sun are main sequence stars, which swell into (larger radii) giants (upper right) and evolve later into white dwarfs (Earth-sized…) as depicted at lower left – as we later discuss… Oct. 30, 2007
And what is an H-R diagram good for? • It provides a direct measure of distance to star clusters since by subtracting M from observed m, we have 5logd - 5 and thus d • It directly illustrates the range of L, T and R of stars, providing further clues to their nuclear burning, structure and evolution • It directly identifies the main sequence stars, like the Sun, which are all (as we shall see) “burning” H into He in their cores • It shows that stars have both spectral types (OBFGKM) as well as luminosity classes (within a given spectral type) • It directly shows (as we shall see) that stars must evolve – first on to the main sequence (when they are born) and eventually off as they become giants and later white dwarfs Oct. 30, 2007