Download
1 / 75
750 likes | 904 Vues
Chart 1a Inflation, 1965 - 1988. * Quarterly data from 1965-I to 1988-IV. Chart 1b Unemployment Rate, 1965 - 1988. ** Monthly data from Jan. 1965 to Dec. 1988. Chart 1c Interest Rate, 1965 - 1988. ** Monthly data from Jan. 1965 to Dec. 1988.

E N D
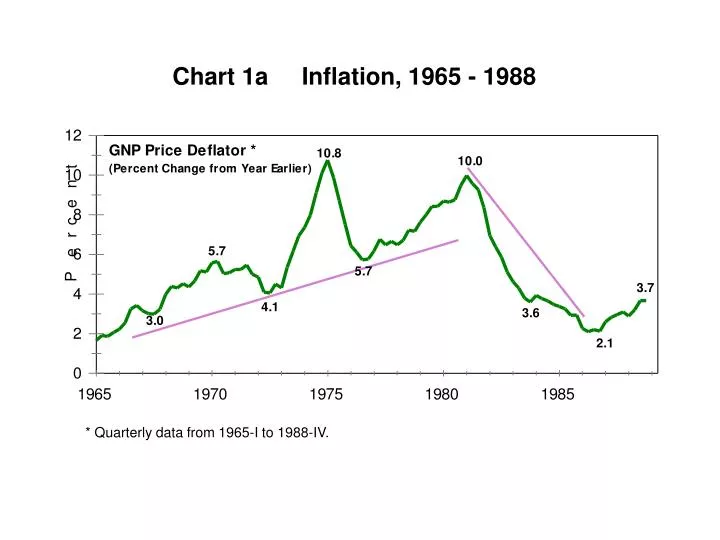
Chart 1a Inflation, 1965 - 1988 * Quarterly data from 1965-I to 1988-IV.
Chart 1b Unemployment Rate, 1965 - 1988 ** Monthly data from Jan. 1965 to Dec. 1988.
Chart 1c Interest Rate, 1965 - 1988 ** Monthly data from Jan. 1965 to Dec. 1988.
Because of deadweight loss and distortions, it costs the country more than a dollar to buy an added dollar of government goods and services (about $2.50 - $3.00 total on average, with some taxes costing much more).
Cost = direct budget outlay + economic damage of tax + and other distortions. (All at the margin.)
Chart 13The Kennedy and Reagan Tax Cuts • The Kennedy rate cuts were roughly the same percentage rate reductions • across the board, but rewards rose most where rates were highest: • Top tax rate cut from 91% to 70%. • After-tax reward rose from 9% to 30%, up 230%. • Bottom tax rate cut from 20% to 14%. • After-tax reward rose from 80% to 86%, up 7.5%. • Similarly for the Reagan Tax cuts: • Top tax rate cut from 70% to 50%. • After-tax reward rose from 30% to 50%, up 67%. • Bottom tax rate cut from 14% to 11%. • After-tax reward rose from 86% to 89%, up 3.5%. In both cases, a greater response by upper-income taxpayers raised the total share of taxes they paid.
Chart 13The Kennedy and Reagan Tax Cuts • The Kennedy rate cuts were roughly the same percentage rate reductions • across the board, but rewards rose most where rates were highest: • Top tax rate cut from 91% to 70%. • After-tax reward rose from 9% to 30%, up 230%. • Bottom tax rate cut from 20% to 14%. • After-tax reward rose from 80% to 86%, up 7.5%. • Similarly for the Reagan Tax cuts: • Top tax rate cut from 70% to 50%. • After-tax reward rose from 30% to 50%, up 67%. • Bottom tax rate cut from 14% to 11%. • After-tax reward rose from 86% to 89%, up 3.5%. In both cases, a greater response by upper-income taxpayers raised the total share of taxes they paid.
Tax Rate and Tax Base interact; Both Matter!True Versus Statutory Marginal Tax Rates If the tax system hits the same income more than once, or if tax rules overstate actual income, then the effective marginal tax rate may be much higher than the apparent statutory marginal tax rate. Example: Suppose the Statutory Marginal Tax Rate is 25%, but each extra $1.00 of income is overcounted as $1.50. Then the True Marginal Tax Rate is 37.5% (37.5% = 25% x 1.5).
Chart 26 Marginal Tax Rates On Estates And Income Contributed To Estates, 2009 90% 85% 81% 80% GST 70% GST 70% Estate Tax 60% GST Estate Tax 50% * Marginal Tax Rate 45% Payroll Tax 40% State Income Tax State Income Tax 30% Estate Tax Estate Tax Federal 20% Federal Income Income Tax 10% Tax 0% Estate Tax Estate Tax and Tax on a Dollar Tax on a Dollar Generation of Interest of Wages (self-employed) Skipping Trust Left in an Estate Left in an Estate * 45% Estate Tax Rate became effective in 2007. Assumes married couple in 33% tax bracket, who are self-employed, with a 6% state income tax. Computed prior to Estate Tax Repeal, which is now scheduled for 2010.
STEPS TOWARD NEUTRALITY: ALL SAVING GETS DEFERRAL OR RETURNS EXEMPT EQUIVALENT; EXPENSING OF INVESTMENT; NO DOUBLE TAX OF CORPORATE INCOME; NO ESTATE AND GIFT TAX.
Elements of Neutral Taxes • All treat saving neutrally vs. consumption. • All employ expensing instead of depreciation. • All are territorial. • All have the same basic tax base. • Differ mainly as to point of collection. 29
Why it Matters History tells us that: • When we have moved toward a neutral tax with lower rates, the economy has boomed. • When we have increased tax biases the economy has faltered. • When we have wasted tax cuts on non-growth-related rebates, nothing good has happened. 25
Objective: Growth • Neutral taxation is best for growth. It can yield: • More saving, investment, and growth. Potentially: • Trillions of dollars of added capital. • Millions of added jobs and higher wages. • Thousands of dollars in added family income. • U.S. would become a jobs and investment magnet. 30
Objective: Simplicity • Neutral taxes are much simpler, even if collected on individual tax forms: • No double taxation. • No limits on savings plans. One universal plan, not dozens. • No separate taxation of capital gains. • No depreciation schedules. • No foreign tax and tax credit. • No phase-outs of exemptions, credits, deductions. 31