Download
1 / 19
190 likes | 406 Vues
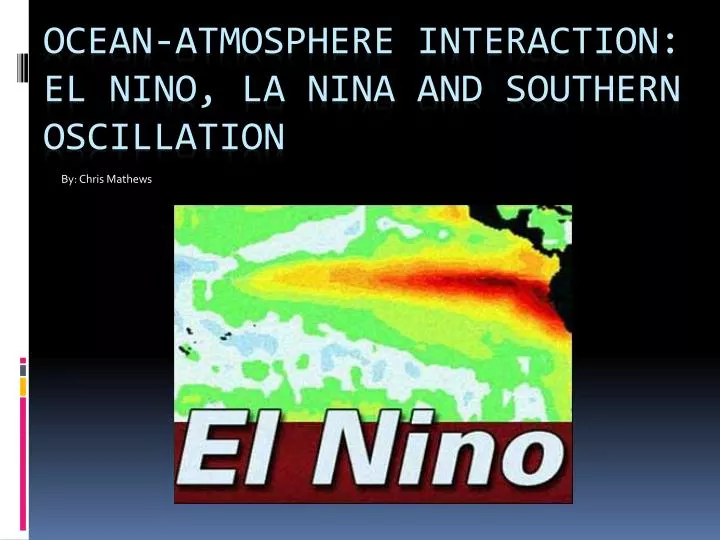
By: Chris Mathews. Ocean-atmosphere interaction: El Nino, La Nina and Southern Oscillation. Short Video…. https://www.youtube.com/watch?v=tn7iTR1K0fM. Random Tweet from NWS. The Papers…. How Many ENSO Flavors Can We Distinguish? By: Nathaniel C. Johnson . Natural variation in ENSO flavors

E N D
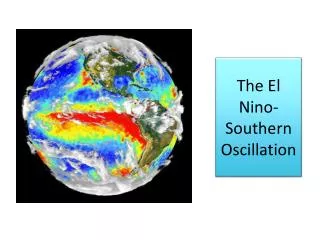
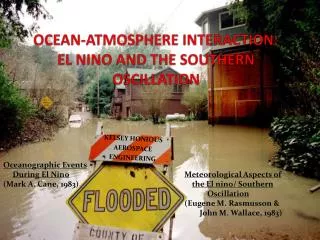
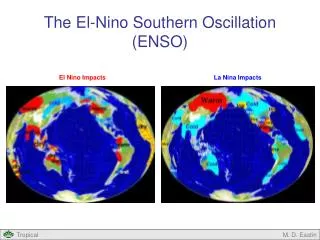
By: Chris Mathews Ocean-atmosphere interaction: El Nino, La Nina and Southern Oscillation
Short Video… • https://www.youtube.com/watch?v=tn7iTR1K0fM
The Papers… • How Many ENSO Flavors Can We Distinguish? • By: Nathaniel C. Johnson • Natural variation in ENSO flavors • By: Matthew Newman, Sang‐Ik Shin and Michael A. Alexander
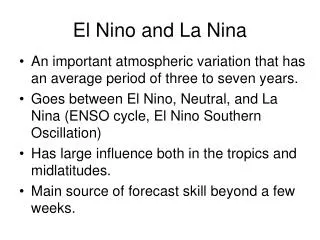
Questions that need answers… • How many ENSO flavors are there? • Why is the frequency of Central Pacific (CP) ENSO episodes increasing? • Will anthropogenic warming increase the frequency of CP events? • Is this just natural variability?
The 1st Paper: How Many ENSO Flavors Can We Distinguish? • Some basic Info.. Nino-4 = Western Pacific Region Nino-3.4 = Central Pacific (CP) Region Nino-3 = Eastern Pacific (EP) Region
Self-Organizing Map Analysis (SOM) • Analysis used to distinguish the maximum number of ENSO flavors • A relatively new neural network–based cluster analysis • Uses SST patterns from the months Sept.-Feb. from 1950-2011 • Distinguishes between cluster patterns and groups them together • The optimal number of cluster (K) must be determined before analysis.
What did SOM come up with? • There are 9 distinguishable ENSO flavors • 1-4 = La Nina episodes 5 = neutral ENSO conditions 6-9 = El Nino episodes
Increase in SOM patterns 3, 4, and 8
Conclusions… • 9 ENSO flavors • Although El Nino SST patterns receive more attention than La Nina SST patterns, La Nina SST patterns have made more of an impact on long-term SST patterns over the past 60 years • Disproportionate western Pacific warming for La Nina patterns • We are experiencing more CP events in recent years, model suggests its just from natural variability
The 2nd Paper: Natural Variations In ENSO Flavors • Null hypothesis: observed changes in ENSO characteristics are consistent with natural seasonal variability with stationary statistics
A Multivariate, “patterns-based”, red noise analysis • Uses data of thermocline depth and wind stress seasonal anomalies • Also uses Linear Inverse Modeling (LIM) which has shown to be a good model in predicting what actually happens
Just look how good LIM is! Better than Univariate AR1 Takes more variables into consideration
NOTICE: EP events more intense but last shorter CP events not as intense but last longer Arrows = wind intensity Circles = depth of Thermocline
Interested in the blue dots, they correspond to strong SST patterns and also contain the initial SST patterns that lead to CP or EP ENSO After the model runs for 6 months, the SST pattern is graphed below. These are the typical EP and CP conditions Conclusion? They may have found the initial conditions that eventually lead to a CP or EP event.
Conclusions • We are having more CP ENSO events • They are not due to global warming • Probably due to natural variations • More modeling needs to be done • Need better modeling with more data • Both SOM and Multivariate analysis conclude a natural variation