Download
1 / 25
250 likes | 324 Vues
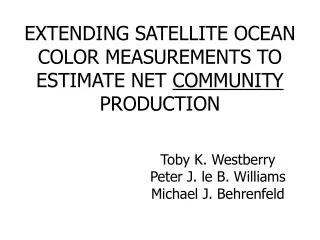
Lagrangian-based estimates of Net Community Production Overall goal : estimation of community production rates by tracking satellite-derived C inventories over time and space

E N D
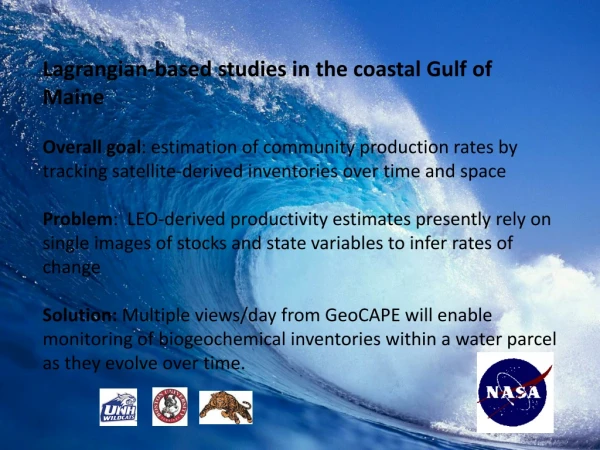
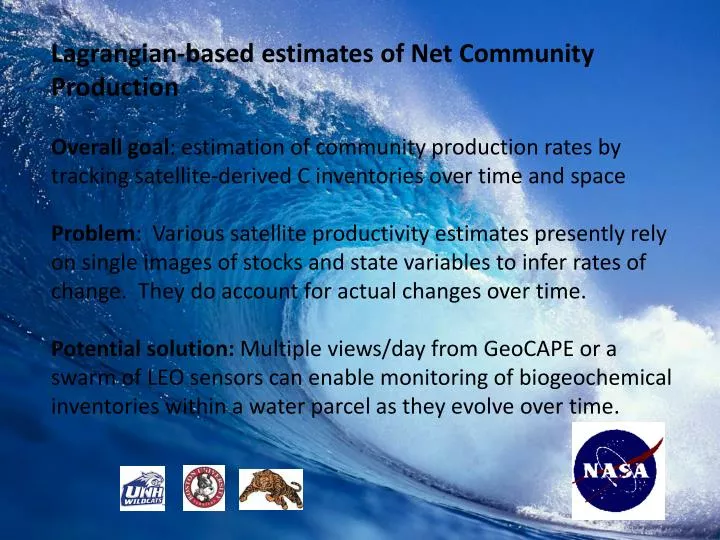
Lagrangian-based estimates of Net Community Production Overall goal: estimation of community production rates by tracking satellite-derived C inventories over time and space Problem: Various satellite productivity estimates presently rely on single images of stocks and state variables to infer rates of change. They do account for actual changes over time. Potential solution: Multiple views/day from GeoCAPE or a swarm of LEO sensors can enable monitoring of biogeochemical inventories within a water parcel as they evolve over time.
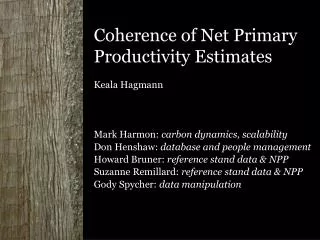
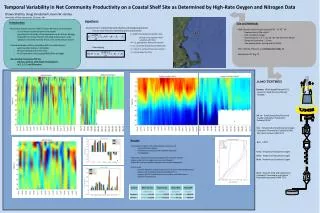
Lagrangian-based Studies in the coastal Gulf of Maine (supplements to NASA-Carbon NNX08AL80G). Part 1: A Lagrangian field experiment to determine net community productivity NCP in the Gulf of Maine Olivia DeMeo (MS Student, UNH), Joe Salisbury (UNH) Part 2: Tracking particle inventories with a high resolution circulation model to infer NCP Bror Jonsson (Princeton), Joe Salisbury (UNH), Amala Mahadevan, (Boston University)
Part 1: The Lagrangian Experiment Approach: 1. Tracked a drogue at 12m (7 cruises over 16 days) 2. Kept track of oxygen and particle inventories We assume these are equivalent (within the context of a homogenous water mass)
Data/ data processing • Raw oxygen, bbp and c-660 and f-chl from profiles were corrected with bottle data • Oxygen inventories corrected for thermodynamic variability, air-sea flux and diffusion, then converted to carbon using the Redfield ratio • Inventories (down to 1% surface PAR) were differenced over time • Additional correction for DOCex, POC flux and bubble injection are underway
Results: Doptically-derived particle inventories versus NCP Chlorophyll (C:Chl = 90:1) r2 = 0.45 y = 0.1882x – 0.2243
r2 = 0.76 y = 0.1058x – 0.2125
r2 = 0.85 y = 0.1432x + 0.0124
Newly corrected for DOCex, POC flux and bubble injection. The slope is close to 1
Conclusions for part 1 • The Good: Significant relationships between D optically derived particle inventories and NCP. Corrections for DOCex, POC sinking and bubble injection brought slopes close to one. • The Bad:Doxygen > Dparticles. We either have too much oxygen or too few particles. Very dependant on the above corrections.
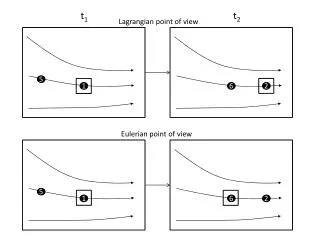
PCt1 PCt2 Part 2: Estimating NCP by tracking sat particle inventories in a Lagrangian context Jonsson, Salisbury, Mahadevan, Campbell (2009) Jonsson, Salisbury, Mahadevan (2011) Premise: (PCt2 - PCt1) NCP (t2 - t1) PC = satChl * Q *ze ze =loge(0.01)=K490 Q modified from Behrenfeld et al., 2005 ***Movie examples shown w/ chl
Net community productivity (gC m2 d-1) mg C m-2 d-1
What we’re working on now: Time and space requirements for satellite data to enable particle inventory tracking • 300m, hourly model and daily cloud free 250 and 500m MODIS data to: • Simulate differences in “net radiance production” between Eularian versus Lagrangian determinations over the course of a day. • Run the same simulation using increasingly large pixel resolutions.
300m GOM-POM model (Salinity) Model output from Huijie Xue (UMO)
How do our results help inform the GEO-CAPE SWG? • Results from part 1 suggest that sub daily changes in particle inventories can be use to to track daytime NCP rates • 3-5 determinations per day may be enough for daily NCP estimates provided the advective component is adequately resolved • For part 2: Preliminary work shows promise towards estimating rates from satellite tracking of particle inventories in a Lagrangian context. • In work still to be done, we anticipate considerable differences between the Lagrangian and Eularian approach (using high resolution data)
CARBON TO CHLOROPHYLL DETERMINATIONS Behrenfeld et al., 2005 Laws and Bannister (1980) For which m is substituted by g
Interpolation of a MODIS chl row over 5 days Linear Lagrangian Time (5days) Longitude