Download
1 / 47
470 likes | 739 Vues
Retirement Income: The Future of Distribution Trends, Opportunities and Challenges. A LIMRA Retirement Markets Presentation. Agenda. This presentation is a benefit of LIMRA membership. No part may be shared with other organizations or reproduced in any form without LIMRA's written permission.

E N D
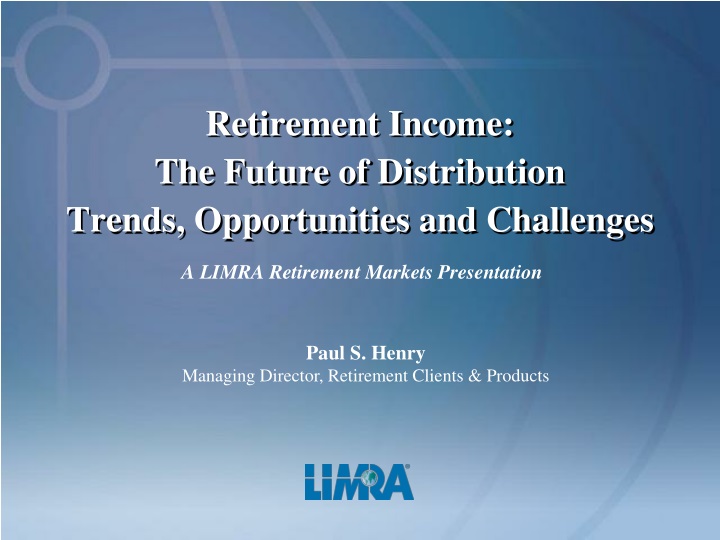
Retirement Income:The Future of Distribution Trends, Opportunities and Challenges A LIMRA Retirement Markets Presentation
Agenda This presentation is a benefit of LIMRA membership. No part may be shared with other organizations or reproduced in any form without LIMRA's written permission. • Retirement Income Market • State of Retirees and Pre-Retirees • Industry Response • The Future of Distribution
Over 30 million Americans approaching “Income Phase” Number of Retirees by Age Millions Percent of Retired 33 million pre-retirees age 55+ 97 million pre-retirees age 40+ Source: LIMRA analysis of U.S. Census Bureau’s Current Population Survey, March 2009 Supplement
The “Income Market” likely to increase 50% by 2025 Number of Projected Retirees by Age Source: LIMRA analysis of U.S. Census Bureau’s Current Population Survey, March 2009 Supplement
More Americans entering retirement Without Pensions Percent Receiving Employment Based Pension Median Annual Pension is $12,000 Source: EBRI estimates of data from the Current Population Survey, Department of Labor, 2010
Assets will be Re-allocated as HH’s transition to retirement Source: LIMRA analysis of 2007 Survey of Consumer Finances, Federal Reserve Board, 2009. Financial Assets by Age and Retirement Status Page 6
Rollover market to exceed $600 billion in 3 years IRA Rollovers (in billions) Sources: Investment Company Institute, The IRA Investor Profile: Traditional IRA Investors’ Rollover Activity, 2007 and 2008 (2010) and LIMRA analysis of Internal Revenue Service, Statistics of Income Bulletins and Bureau of Economic Analysis, NIPA Table 6.11, “Table 6.11D. Employer Contributions for Employee Pension and Insurance Funds by Industry and by Type, years 2001–2007. Figures based on total IRA inflows resulting from rollovers. Includes some IRA-to-IRA rollovers.
Consistent Need for Income to Cover “Basics” Percent of Retirement Expenses by Household Income Source: Retirement Income Trade-offs, Implications for Product Development, LIMRA, 2009. Survey based on 1,188 pre-retirees and retirees aged 55 to 75 with at least $100,000 in household current investable assets.
Middle/Affluent Lack Guaranteed Income Sources Percent of Essential Expenses by Household Income Guaranteed Income Sources by Household Income Source: Retirement Income Trade-offs, Implications for Product Development, LIMRA, 2009. Survey based on 1,188 pre-retirees and retirees aged 55 to 75 with at least $100,000 in household current investable assets. Source: LIMRA analysis of U.S. Census Bureau’s Current Population Survey, March 2009 Supplement. Analysis based upon fully retired households.
Paradigm Shift in Expectations Source: Retirement Income Trade-offs, Implications for Product Development, LIMRA, 2009. Survey based on 1,188 pre-retirees and retirees aged 55 to 75 with at least $100,000 in household current investable assets. Note: Other sources include savings in Mutual Fund/Brokerage, Annuities, Equity in home, Real estate/rental income, inheritance and salary and wages. Most Important Source of Retirement Income
Challenge: Low Savings Average 401(k) Balance by Age and Tenure ($ in thousands) Average 401(k) account balance for plan participants in their 50s and 60s = $77,650 Source: VanDerhei, Jack, Sarah Holden, and Luis Alonso, “401(k) Plan Asset Allocation, Account Balances, and Loans,” Employee Benefits Research Institute (EBRI) Issue Brief No. 335, October 2009. Page 12
Challenge: Manage Timing, Markets & Inflation Value of Portfolio Retirement age 62, $500,000 initial portfolio 4.05% initial withdrawals 1966-1975 Portfolio value Age Note: The portfolio has an asset allocation of 42.5% large company stocks, 17.5% small company stocks, and 40% intermediate-term government bonds and is rebalanced annually. The initial withdrawal amount was $20, 250 or 4.05% of beginning assets; thereafter adjusted based on prior year’s inflation rate.
Challenge: Outliving Assets • Longevity Expectations Retirees Pre-retirees From Retirement Source: Retirement Income Trade-offs, Implications for Product Development, LIMRA, 2009. Survey based on 1,188 pre-retirees and retirees aged 55 to 75 with at least $100,000 in household current investable assets.
Challenge: Working Longer Source: Will Retirement Last a Lifetime?, LIMRA, Society of Actuaries, and InFRE, 2009. Survey based on 1,524 retirees aged 55 to 75 with at least $100,000 in household investable assets. Timing of Retirement
Challenge: The Unexpected Percent of pre-retirees Source: LIMRA survey of 1,000 pre-retirees, February 2010. Page 16
No wonder: Pre-Retirees Feel “Unprepared” “Very Prepared” by Household Income Level Only 30% of pre-retirees consider themselves to be very prepared for retirement Source: LIMRA survey of 1,000 pre-retirees, February 2010. Note: Retirement preparedness measured on a 10-point scale. “Very prepared” based on values 8-10. Page 17
Industry Response to Opportunity: Product Manufacturers Distributors
U.S. Individual Annuity Sales Dollars in Billions Source: LIMRA, U.S. Individual Annuities survey.
Demand for Income Benefit Driving VA Sales Q1 2012 VA New Sales In Billions VA GLB Election Rates When Any GLB Available Source: LIMRA, Variable Annuity Guaranteed Living Benefit Election Tracking Survey.
Fixed Deferred Annuity Sales Dollars in Billions Source: LIMRA, U.S. Individual Annuities survey.
Indexed GLB election rates Industry Indexed Annuity GWLB Election Rates Source: LIMRA, Indexed Annuity Guaranteed Lifetime Withdrawal Benefit Elections Survey.
Older GLB clients are taking income Source: Guaranteed Living Benefit Utilization Study – 2009 Data, LIMRA 2011 Based on 1,278,547 contracts issued in respective years and still in force at the end of 2009.
Immediate Annuity Sales Dollars in Billions Amounts less than $0.5 billion not shown Source: LIMRA, U.S. Individual Annuities survey.
Deferred annuity assets have reached high Dollars in Billions Source: LIMRA, U.S. Individual Annuities survey.
Annuity Sales To grow 2% over next 4 years CAGR 2% 2% 3% Dollars in Billions Source: LIMRA, U.S. Individual Annuities survey.
SPIA sales to reach $13b; 10 Days of Rollovers Source: LIMRA
Q1 2012 Fixed Annuity Sales by Distribution Channel Dollars in Billions Source: US Individual Annuities, LIMRA
Banks/Career Agents lead Fixed-Rate Deferred Sales Source: LIMRA, U.S. Individual Annuities survey.
Career followed closely by Nat’l B/D in Fixed Immediate Source: LIMRA, U.S. Individual Annuities survey.
Independent Agents Dominate Indexed Annuity Sales Source: LIMRA, U.S. Individual Annuities survey.
Advisors are “under-engaged” as clients enter retirement Retirement planning related Investment related Source:Will Retirement Assets Last a Lifetime?, LIMRA, Society of Actuaries, and InFRE, 2009. Survey based on 1,524 retirees aged 55 to 75 with at least $100,000 in household investable assets. How Advisors Help Retirees Page 33
Many advisor lack information on role of income products Retiree Portfolio Longevity with Immediate Annuity Source: Liquidity and the Value of Annuitization, LIMRA, 2009. Illustration of 1969 to 1998, the worst 30-year period out of 53 possible scenarios since 1926. The portfolio has an asset allocation of 42.5% large company stocks, 17.5% small company stocks and 40% intermediate-term government bonds and is rebalanced annually. An annual payout rate of 6.30% was based on actual single-life immediate annuity quotes with inflation adjustments for a hypothetical 65-year-old male in January 2009. The initial withdrawal amount was 4.5% of beginning assets; thereafter annual withdrawals were adjusted based on the prior year’s inflation rate. The hypothetical portfolio had a 50-basis-point charge assessed annually (following the withdrawals and the investment growth or loss.
72% of buyers are age 74 or less Buyer preferences based on age and source of money Percentage of SPIA Buyers by Age 60% of buyers are age 75 & older Source: Guaranteed Income Annuities, LIMRA 2010. The study is based on 55,311 immediate contracts issued in 2008 and 2009.
Buyers Weigh Trade-off’s Features in Lifetime Income Annuities Monthly payout GP – 20+ years Less Features More Source: Based on CANNEX top quotes on $100,000 for a 65 year old male as of 12/07/2010 Page 36
Clients look for decision-making help when “triggers” occur Source:LIMRA, The Retirement Income Reference Book 2009 Retirement Decision Points
Clients seek support across a broad spectrum of issues • Lifestyle budgeting • Asset allocation • Social Security timing • Medicare eligibility and enrollment • Minimizing taxes • Long term care • Survivor income • Estate Planning Confidential and proprietary information – for institutional use only.
Leveraging Contract-Level Data LIMRA’s COMPASS: DATA REPORTING INITIATIVE Distribution Hierarchy Optimize rep productivity by channel, region, firm size Track your market share against competitors at the locallevel Use regional results as benchmarks for performance Determine channel penetration and areas for growth
Collaboration is the best kept secret to success Likelihood of Success (Top Quartile among all Financial Advisors (Indexed to 100) 338 238 213 100 Solo Lower support Higher support Multi-Advisor/Rep * Note 1. Based on rep with 250 clients, and Note 2. Success means top quartile performance of all financial services advisors
Education is being directed to the financial professional *Percentages based on individuals who "strongly" or "somewhat" agreed with the statement. Source: Advisor Perspectives on Retirement Planning, LIMRA, 2012.
More than 6 in 10 advisors believe guaranteed income solutions are well-received by clients *Percentages based on individuals who "strongly"/"somewhat" agreed or "strongly"/"somewhat" disagreed with the statement. "Neither agree nor disagree" excluded from chart. Source: Advisor Perspectives on Retirement Planning, LIMRA, 2012.
A Mobile Application that Engages & Educates www.ready-2-retire.me/PaulHenry
Distribution of the Future? • Pre-retirees will be more engaged, better informed and prepared to make decisions – new technologies will create consumers who are motivated to seek out solutions • The retirement income discussion will permeate the relationship product manufactures, service providers and advisors have with DC Plan participants • Most pre-retirees will continue to fear making a mistake with their single largest financial asset – they will seek out products they can understand and advisors/firms they can trust • Successful Advisors will embrace the role of product allocators, and deliver a broader array of services to retirees
Your Trusted Source for Retirement Industry Knowledge Thank you. Paul S. Henry: 860-285-7878; phenry@limra.com HARTFORD ATLANTA MIAMI TORONTO LONDON KUALA LUMPUR SHANGHAI HO CHI MINH CITY SEOUL