Download
1 / 1
10 likes | 99 Vues
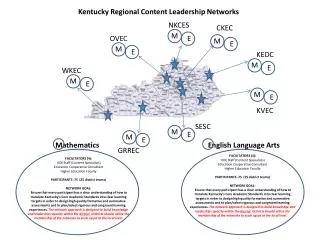
Economic development networks in Kentucky Appalachia. Brandon Ofem , Sara Compion , and Walter Ferrier. Tie Frequency. Collaboration. Research Questions. How do economic development organizations (EDOs) in eastern Kentucky collaborate?

E N D
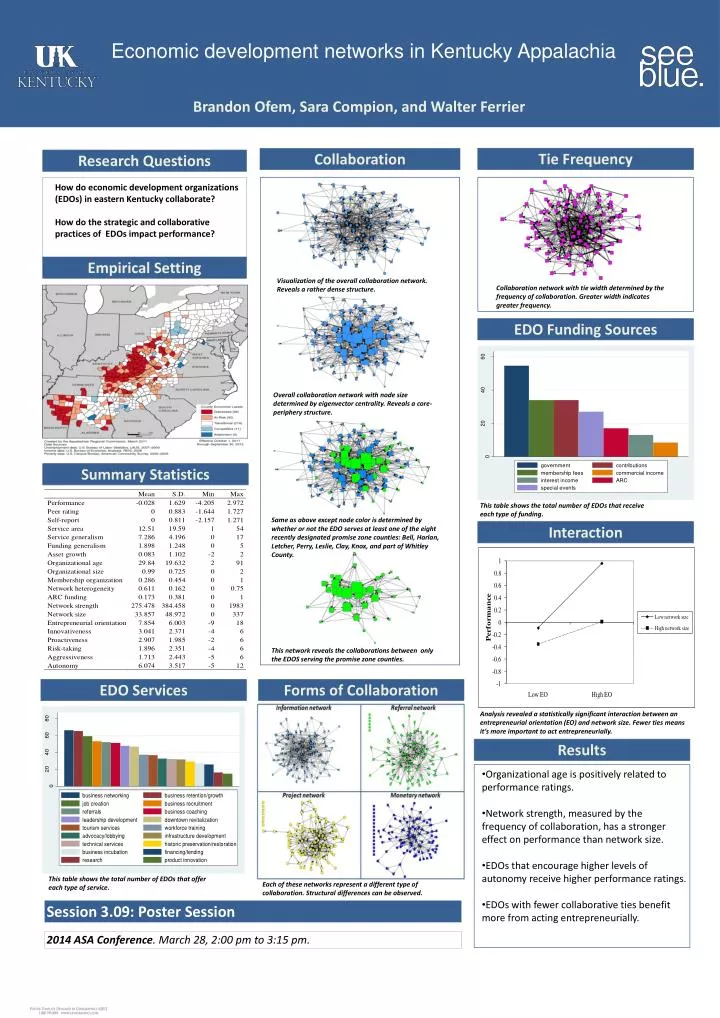
Economic development networks in Kentucky Appalachia Brandon Ofem, Sara Compion, and Walter Ferrier Tie Frequency Collaboration Research Questions • How do economic development organizations (EDOs) in eastern Kentucky collaborate? • How do the strategic and collaborative practices of EDOs impact performance? Empirical Setting Visualization of the overall collaboration network. Reveals a rather dense structure. Collaboration network with tie width determined by the frequency of collaboration. Greater width indicates greater frequency. EDO Funding Sources Overall collaboration network with node size determined by eigenvector centrality. Reveals a core-periphery structure. Summary Statistics This table shows the total number of EDOs that receive each type of funding. Same as above except node color is determined by whether or not the EDO serves at least one of the eight recently designated promise zone counties: Bell, Harlan, Letcher, Perry, Leslie, Clay, Knox, and part of Whitley County. Interaction This network reveals the collaborations between only the EDOS serving the promise zone counties. EDO Services Forms of Collaboration Analysis revealed a statistically significant interaction between an entrepreneurial orientation (EO) and network size. Fewer ties means it’s more important to act entrepreneurially. Results • Organizational age is positively related to performance ratings. • Network strength, measured by the frequency of collaboration, has a stronger effect on performance than network size. • EDOs that encourage higher levels of autonomy receive higher performance ratings. • EDOs with fewer collaborative ties benefit more from acting entrepreneurially. This table shows the total number of EDOs that offer each type of service. Each of these networks represent a different type of collaboration. Structural differences can be observed. Session 3.09: Poster Session 2014 ASA Conference. March 28, 2:00 pm to 3:15 pm.