Download
1 / 39
390 likes | 585 Vues
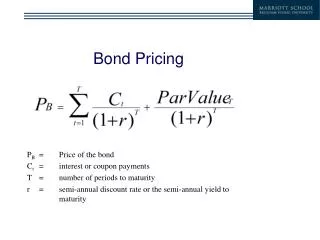
BOND PRICING. Review of Basic Principles & Another Way of Looking at Bond Prices. Basic Present Value/Future Value. Rearranging gives:. More General Relationship. i = annual nominal rate p = # of periods per year i/p = periodic discount rate n = # of years

E N D
BOND PRICING Review of Basic Principles & Another Way of Looking at Bond Prices
Basic Present Value/Future Value Rearranging gives:
More General Relationship i = annual nominal rate p = # of periods per year i/p = periodic discount rate n = # of years n*p= Total # of periods
Example • i=6% • p=1 • n=5 • PV=100 • FV=100(1+.06/1)5*1=100(1.338226) • FV=133.8226 • If we change p to 12: • FV=100(1+.06/12)60 • FV=134.89
Effective Annual Yield • The Effective Annual Yield (Rate) is the annual rate of interest, with no compounding, that gives you the same end of year wealth as the periodic discount rate with compounding.
Example: Effective Annual Yield • Consider a 6% mortgage and a 6% bond. • Which is the better investment ? • First, we will figure out the answer directly– without using EAY • Assume both are purchased at par or face value • Answer the question by calculating future wealth • Bond: • FV=(100)(1+.06/2)2=106.09 • Mortgage • FV=(100)(1+.06/12)12=106.17 • Note that I don’t have to worry about how long I hold the investment (as long as both have same maturity). If mortgage beats bond in year 1– it will keep winning in future years • Only need to look at future wealth at the end of 1 year
Example: Effective Annual Yield • Next, we will use EAY • Bond: From our previous calculations, it is clear that I would be indifferent (i.e., my future wealth would be the same) between owning the bond and owning a simple annual CD that paid 6.09% interest annually. • Mortgage: Similarly, I would be indifferent between owning the mortgage and a 6.17% CD • EAYBond = 6.09% • EAYMortgage = 6.17%
EAY– Why do I only see EAY discussed in textbooks??? • EAY is mathematically correct way to compare and rank yields- but it is rarely used in practice. Why?? • 1. Most of the time we are comparing investments within the same class • Bonds to Bonds Mortgage to Mortgages In these cases, the annual nominal rate, i, is good enough to rank investments Only when you are comparing across classes, do you have to worry about controlling for compounding Matters more at higher yields
EAY • EAY is mathematically correct way to compare and rank yields- but it is rarely used in practice. Why?? • 2. Most fixed income securities are compared to Treasuries • The “i” for bonds with semiannual compounding has a special name– “BEY” • It has become customary to put other investments on the same basis– That is to quote the BEY of a mortgage. • The idea is the same as for EAY, but, we need to modify the basic question to ask “What annual nominal rate on a bond (i.e., the “coupon” of the bond), assuming semiannual compounding at the same rate, would generate the same future wealth (FV) as the mortgage?
BEY of a Mortgage • We already saw that FVMortgage=100(1+.06/12)12=106.17 • What annual nominal rate (or coupon rate) on a bond would give the same FV? (Jargon: we call that annual nominal rate a “Bond Equivalent Yield” or BEY) • More generally:
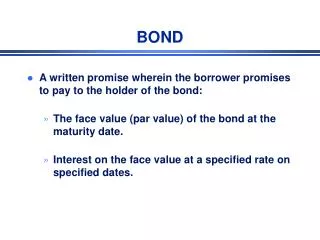
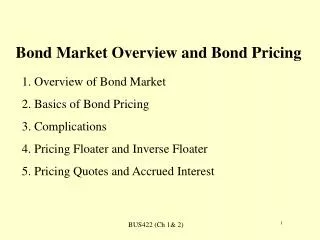
Basic Bond Prices/Yields • Two Objectives • Calculate Price, given Yield • Calculate Yield, given Price • A bond is simply a contractual agreement between 2 parties whereby one party (issuer) promises to make certain payments at various future dates. In return, issuer will receive something of value now– Usually $ • Three Key Attributes that Define a Standard Bond • Maturity • Date at which all obligations to make payments end • Coupon Rate (annual nominal rate) • The interest rate the issuer agrees to pay each year on the outstanding debt amount • Note: If bond pays interest semi-annually, interest due=Par*(CR/2) • Par or Face Value (Par, Principal, Face Value, Maturity Value) • The amount of money the borrower (issuer) agrees to repay by the maturity date. • Note that the $ paid by the buyer at issuance need not equal the face value of the bond. However, when it does, we say that the bond sold at “par” • Discount : $ paid at issuance < Face Value • Premium: $ paid at issuance > Face Value
General Principle of Valuation • Step 1: Identify (estimate) the future cash flows paid by the issuer • Step 2: Determine the appropriate discount rate • Step 3: Calculate the PV of Future cash flows • Issue: Should there be a single discount rate for all future cash flows or should there be a different one for cash flows received at different times?
Is it reasonable to believe that the right discount rate for cash flows received thirty years from now is the same as that for discounting cash flows received in 6 months? The right answer is “NO” – but traditional bond pricing uses a single discount rate so we will too – for a while.
Example: Calculate Price, Given Required Yield • Consider an “annual pay” bond that promises to pay interest of $10/yr for 4 years plus $100 at the end of the 4th year • Maturity = 4 • Principal = 100 • Coupon = 10% • Step 1: Layout the Cash Flows
Example: Calculate Price, Given Required Yield • Step 2: Assume investor required yield is 8% • Obtain from market observation of trading of similar quality/maturity bonds • Step 3: Calculate Present Value • Using a calculator to make life easier:
Calculating Yield Given Price • Consider the same bond • 10%, 4 yr, annual pay • Assume an investor pays $115 for that bond • What yield to maturity will she earn? • Same basic formula applies– we know CF and we know PV– question is what is r? • Solve for r using calculator. Note that almost all calculators Return the periodic discount rate, r, expressed in % not decimal. However, EXCEL works in decimal rates of return, not %.
Basic Principles of Bond Pricing • Because bond prices are Present Values, prices vary with the Discount Rate in a predictable way
Basic Principles of Bond Pricing • Prices Decline with Discount Rate • Inverse relationship between prices and yields • Between 8/27 and 9/5, Treasury yields fell and the prices of Treasuries rose • In fact, cause and effect runs from prices to yields • Prices decline at a declining rate as yields increase • Price curve is “convex” function of the yield • Whenever Coupon rate = Discount rate, price =$100 or price=“Par” • Coupon < Discount Rate PV< Face or “Discount Bond” • Coupon > Discount Rate PV> Face or “Premium Bond”
Basic Principles of Bond Pricing • As a bond moves closer to maturity, its value moves toward par • Assumes the investor yield at original purchase remains constant over time
Basic Principles of Bond Pricing • In the previous graph, the discount rate was held constant as time changed • In practice, the discount rate (investor required yield) changes with time • Bond prices reflect the combination of both effects • Time • Discount rate • Consider another example: 4-yr, 10% annual pay bond. • At t=0, required yield is 8% • Bond price is 106.624254 N=4 i=8 PMT=10 FV=100 Solve for PV=106.624254
Basic Principles of Bond Pricing • Assume now that we are pricing the same bond at the end of the first year. However, instead of assuming that the investor required yield stays the same, assume that it increases to 9% • Change in Price: 102.53-106.62=-4.09 • Change due to maturity : -1.47 • Change due to discount rate: -2.62 • Total Change: -4.09 N=3 i=9 PMT=10 FV=100 Solve for PV=102.5313
Discounting at a Constant Rate? • Treasury yield curve is not flat • Two different Treasury curves • Par or Coupon Curve • Strips Curve • Suppose we observe the following Treasury “Strip” Curve Notice that the investor required yield for cash flows received four years From now is 8%. However, the required yields for earlier cash flows are Less than that.
Pricing Off the Strip Curve • Consider again the simple 10%, 4-yr, annual pay bond • “Unbundle” the bond’s cash flows into the four distinct cash flows received at the end of each year. The price calculated this way (106.95) is greater than the price calculated using a constant 8% (106.62) because the early cash flows are discounted at lower required yields
Arbitrage Opportunity • Assume that the price was set at the single yield price of $106.62 • Calculated as the present value of future cash flows discounted at 8% • Also assume an active Treasury strips market with prices and yields as described in the earlier table • Yields ranging from 6.8% for 1 year to 8% for 4 year cash flows • How can traders profit from this? • Buy the 4 year bond at 106.62 • Create a trust and “strip” off the individual cash flows • Sell the four separate cash flows at the prices indicated earlier.
Another Reason for “No -Arbitrage” Pricing • The Final Maturity of a security is a poor descriptor of the timing of cash flows. • Consider the following three different 10-year Treasury bonds. These three securities represent very different bundles of cash flows It seems unlikely that the market required yield for all three would be the same With no-arbitrage pricing, the “yield” on these securities will vary reflecting the Timing of the cash flows and the current yield curve.
No-Arbitrage Pricing • Observe from the Strip market the price that investors are willing to pay for a $1 “promise to pay” at dates in the future. • Assume these are given by the handout (or the earlier table) • Provides prices and “BEY” for strips securities maturing every six months from now until ten years from now. • View these prices just like the unit prices at the supermarket • Determine how much of a particular cash flow the security has • Multiply that quantity of dollars by the unit price of those dollars • Repeat for all cash flows in the bundle • Sum to find the total price of your “shopping cart”
No-Arbitrage Pricing • The back side of the handout does this for an 8% 10-year bond • Cash flows are $4 at time 1 (6 months from now) • $4 at time 2 … • … • $104 at time 20 (10 years from now) • The price of a $1 promise to pay by the Treasury six months from now is .9852 • This is equivalent to a BEY of 3% or a semi-annual periodic discount rate of 1.5%-- but the price is all we need • Multiplying $4 times .9852 gives us the market value of a $4 promise to pay as $3.94 • Repeat this for each cash flow– multiplying the cash flow times the unit price to find the number in the far right hand side column • Finally, add all the individual values up and we get $115.26 as the no arbitrage price of the 8% 10 year bond.
No-Arbitrage Pricing • As before this price is the “no-arbitrage” price because at this price, traders cannot profit from breaking out the cash flows and reselling them • Example: Say someone priced the cash flows at a single yield of 6% • N=20 • PMT=4 • FV=100 • i=6/2 • PV=114.8775 • An astute investor could buy the entire bundle of cash flows and then sell each piece based on the strips curve. We just saw that this astute investor would then generate $115.2619– for a riskless certain profit of .38 per 100 of face value. • While it may not be worth her while to do this for a $100 investment, for a $10 million investment the profit would be $38,000. Not bad for a few minutes of trading • Similar profits can be made in reverse. Assume you people buying and selling the 8% bond at a price of $115.64 higher than its no arbitrage price. • Strategy now is to sell the bond short (promise to deliver it in the future), buy the needed cash flows in the strip market, reconstitute the true underlying bond and deliver it to the buyer. • As is frequently the case, there are generally more problems with the “short” strategy • Problems going short • Harder to “reconstitute” a bond than it is to strip a bond
No-Arbitrage Pricing • Now, let’s repeat the same pricing exercise but use a 10-year, 6% coupon Treasury instead of an 8% • Periodic cash flows are now $3 instead of $4 and final cash flow is $103 • Strip prices are still the same • The “mix” of cash flows is different with a smaller % of cash flows received early and a larger % received at the end. • Repeating the same exercise of multiplying unit prices by cash flows and adding up, we find a price of $100 • This means the internal rate of return or “yield”, as we traditionally calculate bond yields, is 6% • What this means is that the “weighted average” discount rates in the table, where the weights reflect the present values of the cash flows of the 6% bond, is 6% • The “yield” on the 8% bond (price=115.2619) is 5.95% • All that this tells us is that the weighted average of the discount rates in the handout differ when the weights change • For the 8% bond, there is more weight on the early cash flows leading to the lower weighted average or “yield” • Bottom line: The price of a bond is what really matters. The “yield” we calculate given the price is a derived number that is sometimes useful, but cannot simply be used to price securities where the timing of cash flows differs
No-Arbitrage Pricing 1 Last example • Now we will price the three different 10-year Treasuries we discussed before. • For each, we will first price them using the strip curve • We will compare that price to the one you would get if you priced each bond using the 6% YTM calculated for the 6% bond selling at par. Notes: 1) Zero coupon bond is undervalued using the six percent while the 12% coupon is overvalued. This is because all the cash flows from the zero come at t=20 where YTM was 6.27%. 2) Price difference is smaller when cash flows are similar to those of the 6% bond 3) A 6% bond would be perfectly priced (at par).
No-Arbitrage Pricing 1 Last Comment • There could be a large number of different strip (or spot) yield curves that produce the same price for a given bond. • Simply think of them as different ways to get the same average score. • Consequently, knowing the weighted average (i.e., the “yield”) tells you very little about the specific components. • Therefore, knowing the YTM for coupon bonds that have different bundles of cash flows tells you relatively little about how to price bonds with different cash flows.
How good are yields as measures of return? • Sources of Return from investing in a bond • Coupon payments made by the issuer over time • Capital gain/loss based on the difference between what an investor pays at purchase and what he/she receives at maturity or upon sale. • Income from reinvestment of interim cash flows
Yield to Maturity • YTM is the single interest rate (discount rate) that makes the present value of cash flows from a bond equal to its market or purchase) price. • If we know Price (P or PV) and we know CF1, CF2, …CFN, • Then it is a “simple” matter to solve for r
Yield to Maturity Note that every 10-year bond has a different YTM because each bond represents a different combination of elements from the same yield curve.
Limitations of YTM • Does not accurately price other securities with different cash flow timing • Does not consider reinvestment of interim cash flows • You will only earn 6% on the 6% bond purchased at par if you can reinvest all coupons at 6% • Zero coupon bond has no reinvestment risk • Assumes bond is held to maturity • Consider the 12% bond. If we buy it today and sell it six months from now (right after collecting the $6 coupon payment), what is our return?
Holding Period Return • Assume rates do not change (and here I mean that the exact same spot yield curve applies) • What should the market price of the bond be at that time? • $144.895 • How did I get this? As before: CF1*.9852+CF2*.9678… • What yield will I earn? • N=1 • PV=-145.786 • FV=144.895+6=150.895 • PMT=0 • Solve for i=3.5 (annualized=7%) • Reconciliation: • Coupon = 6.00 • Capital Loss = (.89) • Net: 5.11 and 5.11/145.786=3.5
Holding Period Return • Only if I estimated the price at time of sale at t=1 using a 5.879% YTM, would I get a holding period return equal to 5.879% • N=19 • FV=100 • PMT=6 • i=5.879/2 • Solve for PV=Sale Price=144.07 • Now we have: • Coupon: 6.00 • Cap Loss: (1.716) • Net : 4.28 and 4.28/145.786=2.94*2=5.88 • But, for the YTM on 9.5 year bonds to be 5.879, the spot yield curve would have to shift (down)
Bottom Lines • Fixed Income Securities Trade on Price --- Not YTM • YTM is a summary measure of the market return one can earn from a security • No chicken and egg issue here, however. Clearly, the price comes first and the YTM is calculated based on the price. • YTM is a weighted geometric average of all the different returns along the yield curve. • Weights are the present values of the cash flows • Using the YTM of one 10-year bond to price other 10-year bonds can generate very misleading values.