Download
1 / 5
50 likes | 162 Vues
Footy Theme-park Ballet Opera Musical Play at QPAC Live Comedy. ** Please note: this scale shows % of respondents who over or under estimated NOT % size of over or under estimations. PRICE PERCEPTIONS – Over and Under Estimations.

E N D
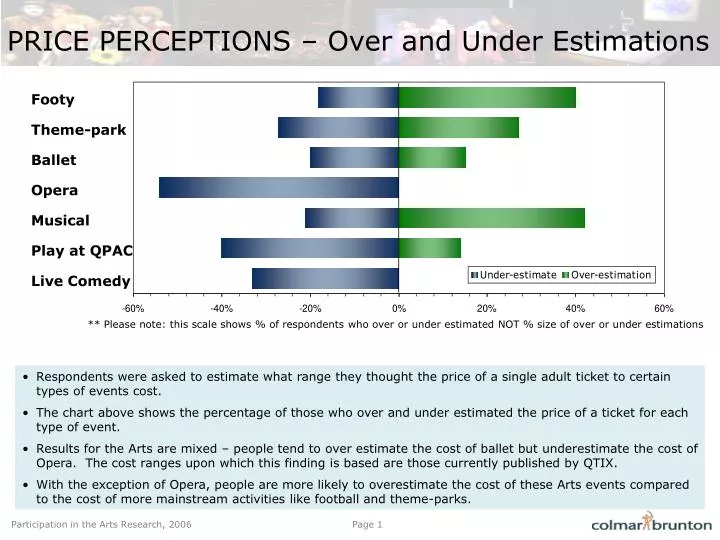
Footy Theme-park Ballet Opera Musical Play at QPAC Live Comedy ** Please note: this scale shows % of respondents who over or under estimated NOT % size of over or under estimations PRICE PERCEPTIONS – Over and Under Estimations • Respondents were asked to estimate what range they thought the price of a single adult ticket to certain types of events cost. • The chart above shows the percentage of those who over and under estimated the price of a ticket for each type of event. • Results for the Arts are mixed – people tend to over estimate the cost of ballet but underestimate the cost of Opera. The cost ranges upon which this finding is based are those currently published by QTIX. • With the exception of Opera, people are more likely to overestimate the cost of these Arts events compared to the cost of more mainstream activities like football and theme-parks.
PublishedPriceRange PRICE PERCEPTIONS – TOTAL SAMPLE Q13a. Approximately how much do you think the cost of a single adult ticket is to the following events? N=429 • For many events, perceptions of pricing are well outside of the usual price for this type of event. This may represent a barrier to participation if people believe this type of event is outside of their price range e.g. the Ballet where over 40% of people thought this type of event was more expensive than it is. • The next page describes a major disparity between segments in terms of pricing…..
Significant Diffs PRICE PERCEPTIONS – PROPORTIONS WHO “DON’T KNOW” PRICE –BY SEGMENT • For all events the Disinclined segment were the least likely to know the price of the event. There was no clear difference between the proportion of “Don’t knows” by Region. • This proportion was significantly larger for the higher Arts. The significant differences between segments are all related to events that Disinclined people are unlikely to have attended in the last year (we did not question attendance at ticketed museum exhibitions). • A play at QPAC was the event that had the greatest proportion of respondents from both segments who could not estimate a price, despite the fact that QPAC is a well known venue. • Given low venue attendance this may well be due to lack of experience with the venue – it tells us that current promotional material may not be tackling the major barrier of Cost sufficiently.
LEAD TIMES, TICKET PURCHASING & PRICING SUMMARY • Lead Times • A significantly higher proportion of respondents take more than three weeks in lead time where the event is a ticketed ‘evening time’ type event. However, this only relates to “musicals”, “comedy” and “live music/Bands”. The Qualitative stage told us that these events were most costly and popular where a big name was appearing, so this may account for the longer lead times despite the general innocuity of these artforms. There were no significant differences across segment, or region, in this regard. • Purchasing Tickets • In keeping with the trend for reactive, rather than proactive, participation in the Arts, the Interested are significantly more likely to use third party ticket websites or sales offices to purchase tickets, whereas the Disinclined show a tendency to call event specific phone lines (as advertised along with the event) or to go to free events. Advertising specific directions for obtaining tickets along with events may remove a practical barrier to participation for the Disinclined segment. As lower participants in the Arts, they may not be as familiar with the existence of services like Ticketek and may also be less inclined to search for such services to get tickets. • This trend is mirrored by the Brisbane vs. Regional segments. Brisbane residents are significantly more likely to use third party sales offices than regional residents, who are conversely, significantly more likely to use event specific ticket lines. • Event specific websites were the most preferred source to buy tickets across segments and regions. This may be related to the qualitative finding that respondents want one, easy to access, central, comprehensive source of information about an event. • Pricing Perceptions • There was a significant difference in the proportion of Disinclined respondents who said they did not know what the ticket price for Arts events was compared to the Interested segment. There was no clear difference between Brisbane Metro and Regional price perceptions. • In the case of Ballet and Opera 29% and 27% of the sample respectively, did not know what a ticket might cost. In addition a relatively large proportion of the sample did not estimate the price of a ticket within the range of published prices. Therefore it can be assumed that the sample generally, but particularly the Disinclined segment, may experience price perceptions as a barrier to participation in the arts.
Section 4: Venue Awareness, Experience and Perceptions