Download
1 / 1
10 likes | 146 Vues
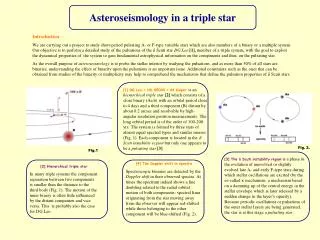
Asteroseismology of. Balloon 090100001. Faulkes Telescope North. Balloon 090100001 Balloon 09010001 is a pulsating subluminous B (sdB) star. It is a very old star burning helium at its centre. It oscillates with several periods from 118s to 4378s.

E N D
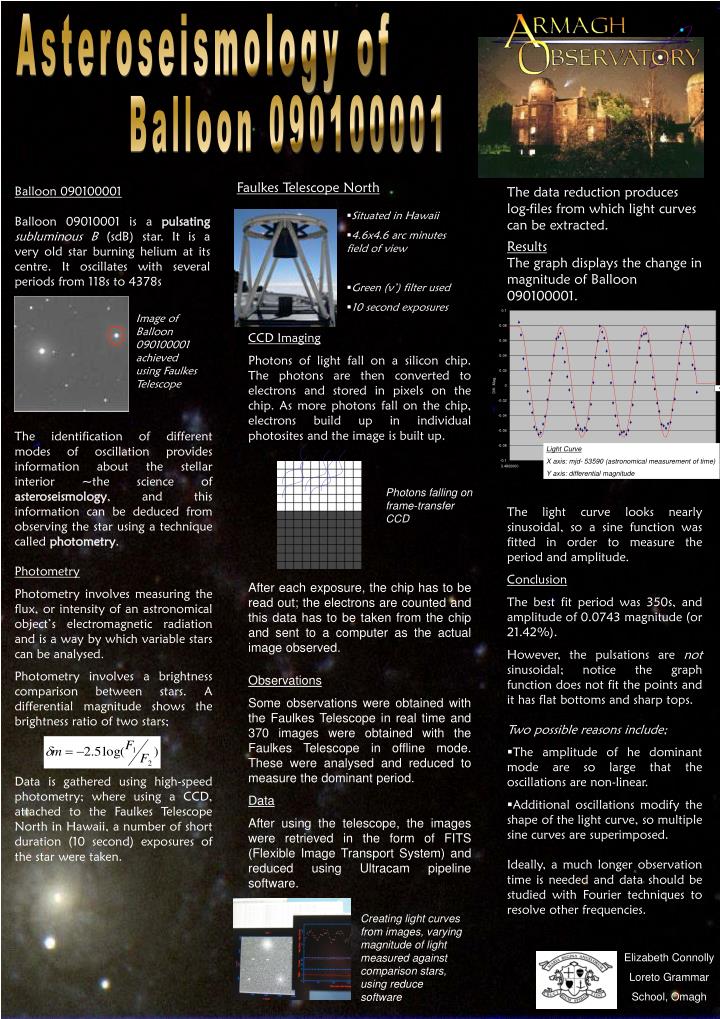
Asteroseismology of Balloon 090100001 Faulkes Telescope North Balloon 090100001 Balloon 09010001 is a pulsatingsubluminous B (sdB) star. It is a very old star burning helium at its centre. It oscillates with several periods from 118s to 4378s The data reduction produces log-files from which light curves can be extracted. Results The graph displays the change in magnitude of Balloon 090100001. • Situated in Hawaii • 4.6x4.6 arc minutes field of view • Green (v’) filter used • 10 second exposures Image of Balloon 090100001 achieved using Faulkes Telescope CCD Imaging Photons of light fall on a silicon chip. The photons are then converted to electrons and stored in pixels on the chip. As more photons fall on the chip, electrons build up in individual photosites and the image is built up. The identification of different modes of oscillation provides information about the stellar interior ~the science of asteroseismology, and this information can be deduced from observing the star using a technique called photometry. Photometry Photometry involves measuring the flux, or intensity of an astronomical object’s electromagnetic radiation and is a way by which variable stars can be analysed. Photometry involves a brightness comparison between stars. A differential magnitude shows the brightness ratio of two stars; Data is gathered using high-speed photometry; where using a CCD, attached to the Faulkes Telescope North in Hawaii, a number of short duration (10 second) exposures of the star were taken. Light Curve X axis: mjd- 53590 (astronomical measurement of time) Y axis: differential magnitude Photons falling on frame-transfer CCD • The light curve looks nearly sinusoidal, so a sine function was fitted in order to measure the period and amplitude. • Conclusion • The best fit period was 350s, and amplitude of 0.0743 magnitude (or 21.42%). • However, the pulsations are not sinusoidal; notice the graph function does not fit the points and it has flat bottoms and sharp tops. • Two possible reasons include; • The amplitude of he dominant mode are so large that the oscillations are non-linear. • Additional oscillations modify the shape of the light curve, so multiple sine curves are superimposed. • Ideally, a much longer observation time is needed and data should be studied with Fourier techniques to resolve other frequencies. After each exposure, the chip has to be read out; the electrons are counted and this data has to be taken from the chip and sent to a computer as the actual image observed. Observations Some observations were obtained with the Faulkes Telescope in real time and 370 images were obtained with the Faulkes Telescope in offline mode. These were analysed and reduced to measure the dominant period. Data After using the telescope, the images were retrieved in the form of FITS (Flexible Image Transport System) and reduced using Ultracam pipeline software. Creating light curves from images, varying magnitude of light measured against comparison stars, using reduce software Elizabeth Connolly Loreto Grammar School, Omagh