Download

1 / 19
190 likes | 269 Vues
Runoff Simulations in Region12 (or almost the State of Texas). Bryan Hong, Ph.D. Outline of the Major Tasks. Preparing atmospheric forcing input for NOAH land surface model 1. Obtaining model predicted or observed data

E N D
Runoff Simulations in Region12 (or almost the State of Texas) Bryan Hong, Ph.D.
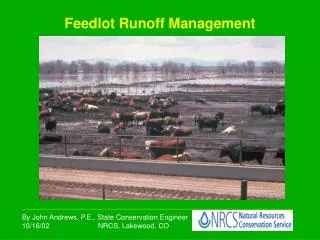
Outline of the Major Tasks Preparing atmospheric forcing input for NOAH land surface model 1. Obtaining model predicted or observed data - Next Generation Rain data (NEXRAD) for precipitation and North American Land Data Assimilation System (NLDAS) for others. - Research period : from 2004 to 2007 (4 years) 2. Data processing for model input - Spatial down-scaling - Converting data format Producing more accurate runoff simulations for Cedric’s routing model (RAPID) 1. Analyzing various simulations based on different runoff schemes 2. Analyzing runoff changes based on vegetation or soil parameter changes
Meteorological Variables List of variables for model input NLDAS from NCEP Eta Data Assimilation System (EDAS) output fields via http://ldas.gsfc.nasa.gov • Air Temperature at 2 m (K) • Specific Humidity at 2m (kg/kg) • Surface Pressure (Pa) • U Wind Component (m/s) • V Wind Component (m/s) • Downward Short Wave Radiation (W/m2) • Downward Long Wave Radiation (W/m2) • Total Precipitation (mm/s) from Cosgrove, 2002 at GAPP meeting
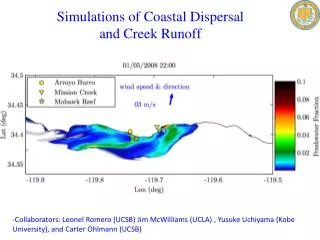
Meteorological Variables NEXRAD rainfall Precipitation NCEP/EMC 4km Gridded (GRIB) Stage IV Data via http://data.eol.ucar.edu From http://www.dfanning.com/
Study Domain (Region 12) Map Projection Albers Spatial Resolution 4500m Number of grid boxes 228 X 228 Total area About 1M km2
Data Processing Missing NEXRAD data Complemented by Stage II data Lost grids around coast lines due to the coarse resolution of NLDAS Filled with the values of nearest neighbor grids Lost grids around coast lines NLDAS coverage Study domain coverage Lost grids
Runoff Model Experiments Based on Niu et al., 2009 TOPMODEL + groundwater scheme (Niu et al., 2007) Biosphere-Atmosphere Transfer scheme (Dickinson et al., 1993) Original NOAH surface runoff scheme (schaake, 1996) TOPMODEL + equilibrium water table (Niu et al., 2005)
Runoff Simulation Comparison to stream flow observations in Guadalupe and San Antonio River Basins SYMGM Group BATS Group Guadalupe River Basin San Antonio River Basin Closer mean but too high STDV Lower mean but closer STDV
Guadalupe River Basin NOAH β + SYMGM Discharge (m3/s) 2004 2005 2006 2007 CLM β + SYMGM Discharge (m3/s) 2005 2006 2007 2004 BATS β + SYMGM Discharge (m3/s) 2004 2005 2006 2007
Guadalupe River Basin NOAH β + BATS Discharge (m3/s) 2004 2005 2006 2007 CLM β + BATS Discharge (m3/s) 2005 2006 2007 2004 BATS β + BATS Discharge (m3/s) 2004 2005 2006 2007
San Antonio River Basin NOAH β + SYMGM Discharge (m3/s) 2004 2005 2006 2007 CLM β + SYMGM Discharge (m3/s) 2005 2006 2007 2004 BATS β + SYMGM Discharge (m3/s) 2004 2005 2006 2007
San Antonio River Basin NOAH β + BATS Discharge (m3/s) 2004 2005 2006 2007 CLM β + BATS Discharge (m3/s) 2005 2006 2007 2004 BATS β + BATS Discharge (m3/s) 2004 2005 2006 2007
Other Experiments Land Cover Effect ? MAJOR LAND USE For two river basins Kim, 2008 at NASA IDS meeting Guadalupe Built-up land (4.0) Dry Crop/Pasture (51.8) Crop/Grass Mosaic (34.5) Mixed Forest (3.8) San Antonio Built-up land (4.0) Dry Crop/Pasture (51.8) Crop/Grass Mosaic (34.5) Grassian (3.8) Changing vegetation properties (roughness length and stomatal resistance) do not increase runoff much.
Other Experiments Soil Texture Effect ? The land surface model uses only one soil texture either bottom or top soil Runoff results does not show much difference between the use of soil texture maps.
Runoff vs. Rainfall Choice of Rainfall Input? Comparison of Runoff simulation to Rainfall inputs OBS : Stream Flow Measurements for River Basins (m3/s) EXP1 : Experiment with the ground runoff scheme and NOAH β (Niu et al., 2009) EXP8 : Experiment with the BATS runoff scheme and CLM β (Niu et al., 2009) NLDAS : 20% of NLDAS precipitation NEXRAD : 20% of NEXRAD precipitation cf. All experiments shown above have been conducted with the NEXRAD rain data. Assumed Runoff ≈ 20% of rainfall
Subsurface Runoff Analysis What Happen in Runoff? A simple analysis for subsurface runoff and comparison to OBS. • Assumptions • During drying periods (no precipitation periods), subsurface runoff is the only source for stream flow. Standard deviations of subsurface runoff are generally low, indicating that water is steadily supplied from ground water. • When surface runoff is almost zero (less than 1.0 m3/s in this analysis), the observations also represent stream flows only from subsurface runoff. Total analyzed dates for dry seasons : 1020 of total 1461 dates for Guadalupe river basin 815 for San Antonio river basin
Summary • Experiments indicates that choice of β scheme is not much effective to runoff variation. • If the SYMGM runoff scheme is the best choice as shown in the previous research , we need more water for runoff simulation. • For the two river basin areas, changing vegetation and soil parameters is not substantially effective to increase runoff amount. • NEXRAD rain is a better choice to more water input than NLDAS rain. • The land surface model underestimates subsurface water in those two river basin areas.
Future Works • Need runoff output validation with stream flow observations for entire Region12 • Comparison the routing simulations with different runoff outputs from SYMGM and BATS runoff schemes • Comparison runoff simulations between predicted vegetation from the dynamic leaf model and NASA remote sensing data such as NDVI and LAI from MODIS • Experiments with various saturated hydraulic conductivities to obtain more subsurface runoff PLEASE, GIVE ME WATER!! THANKS
Guadalupe River Basin Discharge (m3/s) 2005 2006 2007 2004 San Antonio River Basin Discharge (m3/s) 2004 2005 2006 2007 Cf. NEXRAD : 20% of NEXRAD precipitation