Download
1 / 18
180 likes | 274 Vues
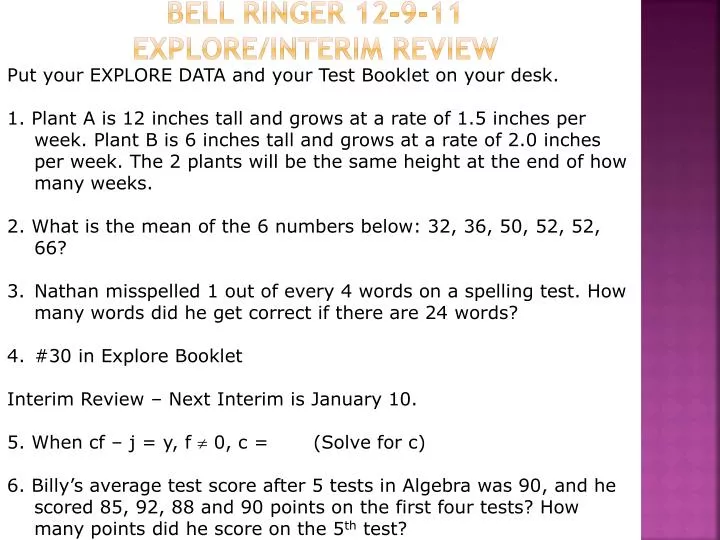
Bell Ringer 12-9-11 EXPLORE/Interim Review. Put your EXPLORE DATA and your Test Booklet on your desk.

E N D
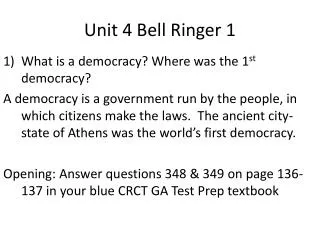
Bell Ringer 12-9-11EXPLORE/Interim Review Put your EXPLORE DATA and your Test Booklet on your desk. 1. Plant A is 12 inches tall and grows at a rate of 1.5 inches per week. Plant B is 6 inches tall and grows at a rate of 2.0 inches per week. The 2 plants will be the same height at the end of how many weeks. 2. What is the mean of the 6 numbers below: 32, 36, 50, 52, 52, 66? Nathan misspelled 1 out of every 4 words on a spelling test. How many words did he get correct if there are 24 words? #30 in Explore Booklet Interim Review – Next Interim is January 10. 5. When cf – j = y, f 0, c = (Solve for c) 6. Billy’s average test score after 5 tests in Algebra was 90, and he scored 85, 92, 88 and 90 points on the first four tests? How many points did he score on the 5th test?
1-6 Relations Objectives: By the end of this class period, with an 85% accuracy, students will be able to: • Represent relations in multiple ways • Identify dependent and independent variables in real-life situations • Describe what is happening in graphs of relations
3 Ways to represent a relation Practice A. Express the relation {(4, 3), (–2, –1), (2, –4), (0, –4)} as a table, a graph, and a mapping. Table List the x-coordinates in the first column and the corresponding y-coordinates in the second column.
Representations of a Relation {(4, 3), (–2, –1), (2, –4), (0, –4)} B. Graph each ordered pair on a coordinate plane on the graph paper provided (top right).
Domain x Range y 4 –2 2 0 3 –1 –4 Representations of a Relation {(4, 3), (–2, –1), (2, –4), (0, –4)} C. MappingList the x-values in the domain and the y-values in the range. Draw an arrow from the x-value to the corresponding y-value.
Domain and range • Domain (D) is the set of all x-values (the 1st number in the ordered pair) • Range (R) is the set of all y-values (the 2nd number in the ordered pair)
Representations of a Relation D.Determine the domain and range for the relation {(4, 3), (–2, –1), (2, –4), (0, –4)}. The domain for this relation is {-2, 0, 2, 4}. The range is {-4, –1, 3}.
A.C. B.D. Individual Practice A.Expressthe relation {(3, –2), (4, 6), (5, 2), (–1, 3)} as a mapping.
Independent and Dependent Variables An independent variable is the value of the variable that determines the output. x is the independent variable. It can stand alone. A dependent variable is the value that is dependent on the independent variable. y is the dependent variable. It depends on the other variable. y depends on x Example: 1 Your height increases as you get older. What are the independent and dependent variables for this relation? A person’s age and height. Which variable depends on the other? Your height depends on how old you are (age). Height is the dependent variable. Age is the independent variable.
Example 2 2. CLIMATEIn warm climates, the average amount of electricity used rises as the daily average temperature increases, and falls as the daily average temperature decreases. Identify the independent and the dependent variables for this relation. What are the 2 variables? Temperature and electricity usage. Electricity usage depends on the temperature. Temperature is the independent variable since it is unaffected by the amount of electricity used. Electricity usage is the dependent variable since it is affected by the temperature.
Example 3 B. The number of calories you burn increases as the number of minutes that you walk increases. Identify the independent and the dependent variables for this relation. What are the 2 variables? The number of minutes you walk (time) and the number of calories burned. Number of calories burned depends on the number of minutes walked (time). The time is the independent variable. The number of calories burned is the dependent variable since it is affected by the time.
A. In a particular club, as membership dues increase, the number of new members decreases. Identify the independent and dependent variable in this relation. A. The number of new members is the independent variable. The dues is the dependent variable. B. Membership dues is the independent variable. The number of new members is the dependent variable. C.yis the independent variable. xis the dependent variable. D. Both variables are independent.
B. The area of a square increases as the length of a side increases. Identify the independent and dependent variable in this relation. A. The length of the side is independent, and the the area of the square is dependent. B. The area is independent, and the side length is dependent. C. Both variables are independent. D. Both variables are dependent.
Analyze Graphs A relation can be graphed without a scale on either axis. These graphs can be interpreted by analyzing their shape. See p. 42 Example 3 See graph Y depends on x. The distance depends on the time. Distance – dependent and time - independent As the time increases the distance increases until the graph becomes a horizontal line. Time increases but the distance remains the same. At this section, she stopped. Then she continued to ride her bike.
Analyze Graphs Example: The graph represents the temperature in Ms. Coleman’s classroom on a winter school day. Describe what is happening in the graph. (y) Temperature depends on the (x) time. Temperature – dependent and time independent Sample: The temperature increases after the heat is turned on. Then the temperature goes up and down because of the thermostat. Finally, the temperature drops when the heat is turned off.
The graph represents Macy’s speed as she swims laps in a pool. Describe what is happening in the graph. A. Macy is doing bobs. B. Macy’s speed increases as she crosses the length of the pool, but then decreases to zero when she turns around at the end of each lap. C. Macy is swimming at a constant speed. D. Macy’s speed continues to decrease.
Exit Slip 1. P. 65 #63 Express the relation shown in each table, mapping or graph as a set of ordered pairs. 2. p. 43 #7
HOMEWORK 12-9 p. 44 20-26 all Read 1-7 Take Notes Bring Graph Paper daily.