Download
1 / 3
30 likes | 616 Vues
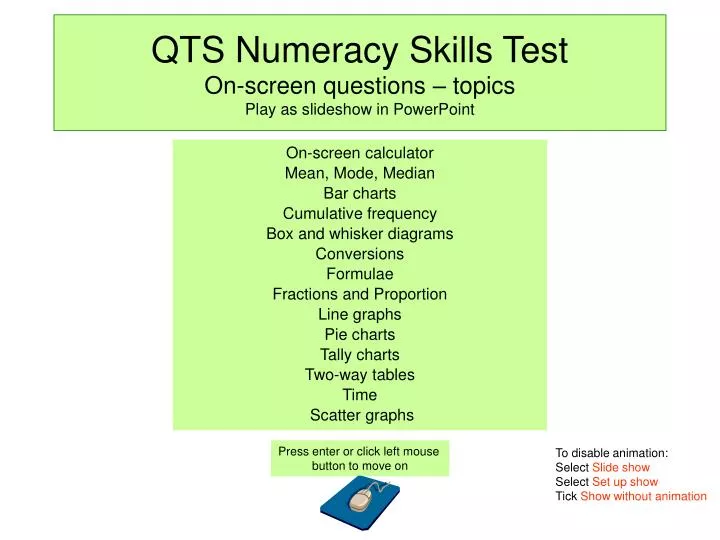
Press enter or click left mouse button to move on. QTS Numeracy Skills Test On-screen questions – topics Play as slideshow in PowerPoint. On-screen calculator Mean, Mode, Median Bar charts Cumulative frequency Box and whisker diagrams Conversions Formulae Fractions and Proportion

E N D
Press enter or click left mouse button to move on QTS Numeracy Skills TestOn-screen questions – topicsPlay as slideshow in PowerPoint On-screen calculator Mean, Mode, MedianBar charts Cumulative frequencyBox and whisker diagramsConversions Formulae Fractions and Proportion Line graphs Pie charts Tally charts Two-way tables Time Scatter graphs To disable animation: Select Slide show Select Set up show Tick Show without animation
1234 12345 Backspace 0 Backspace C CE 7 7 = x 49 6 7 = + 13 8 7 ÷ 9 5 4 6 x 2 1 – 3 6 2 = ÷ 2 3 = 1 + x 3 0.285714 15 . 0 = + The On-Screen Calculator Become familiar with the calculator buttons Answer window CE means clear last entry divide C means clear all calculation multiply Backspace deletes the number on the right of the answer window subtract = do the calculation Decimal point add Enter numbers and operations with your mouse Strictly this is wrong, since we do the multiply first then the addition. To 1 decimal place this is 0.3 Mathsmadeeasy.co.uk
This is the highest boy’s grade = A This is the lowest girl’s grade = E Fraction achieving A*– C was 16 28 6 8 1 2 = ÷ 0.5714 Scatter graph A school used a graph showing predicted GCSE grades from KS3 point scores for history. The solid line shows the national progress from KS3 to GCSE in history. There were 28 students in the class. Which statements are true. History GCSE predictions from KS3 average point scores A* A All girls achieved at least grade E One boy achieved grade A* 6 students achieved grade C More than 55% of students achieved grade A*-C B 6 students achieved grade C C D Predicted GCSE History grade Girls Boys E F G 10 17 18 19 20 21 22 23 24 25 26 27 28 29 30 31 32 33 34 35 36 37 38 39 40 41 42 43 44 45 46 47 and above Key Stage 3 2003 Average Points Score and below Total number of students obtaining A*– C = 16 Total number of students = 28 0.57 is the same as 57% Mathsmadeeasy.co.uk