Download
1 / 50
500 likes | 652 Vues
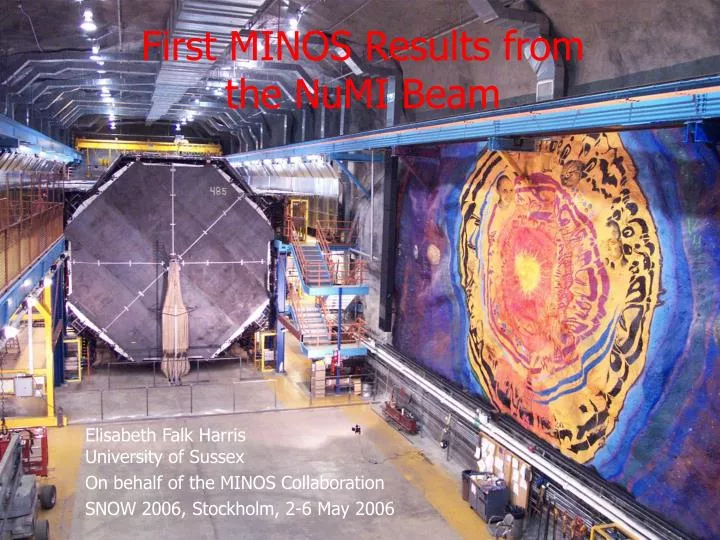
First MINOS Results from the NuMI Beam. Outline. Introduction to the MINOS experiment Overview of MINOS physics goals The NuMI facility and the MINOS detectors Near Detector and beam measurements Selecting CC muon neutrino events Near Detector distributions and comparison with Monte Carlo

E N D
Outline Introduction to the MINOS experiment • Overview of MINOS physics goals • The NuMI facility and the MINOS detectors Near Detector and beam measurements • Selecting CC muon neutrino events • Near Detector distributions and comparison with Monte Carlo Far Detector analysis • Selecting beam neutrino candidates • Near-Far extrapolation of the neutrino flux • Oscillation analysis with 0.93 x 10²⁰ POT E. Falk Harris, U. Sussex SNOW 2006 Stockholm
Far Detector Near Detector 735 km The MINOS Experiment • Main Injector Neutrino Oscillation Search • Accelerator-based long-baseline neutrino experiment • Precision experiment at the atmospheric Dm2 • One nm beam: NuMI • 120 GeV protons from Fermilab Main Injector • Two detectors • Near Detector: measure beam composition and spectrum • Far Detector: search for evidence of oscillations E. Falk Harris, U. Sussex SNOW 2006 Stockholm
m223 MINOS Physics Goals ne appearance • Verify nmnt mixing hypothesis • Make a precise (< 10%) measurement of the oscillation parameters Dm223 and sin2 2q23 • Search for subdominant nmne oscillations • Search for/rule out exotic phenomena • Sterile neutrinos • Neutrino decay • First measurement of n vs. n oscillations – CPT test • First large underground detector with magnetic field • Atmospheric neutrino oscillations: • First MINOS paper: Phys. Rev. D73, 072002 (2006) (hep-ex/0512036) nmdisappearance if E. Falk Harris, U. Sussex SNOW 2006 Stockholm
Monte Carlo Monte Carlo Unoscillated Oscillated 1 2 Oscillation Measurement nmspectrum Look for a deficit of nm events at Soudan… 2 1 Allowed regions from Super-K and K2K spectrum ratio Current best measurements of Dm223 and sin2 2q23 are provided by Super-Kamiokande (atmospheric neutrino analysis) and K2K (9x10¹⁹ pot) E. Falk Harris, U. Sussex SNOW 2006 Stockholm
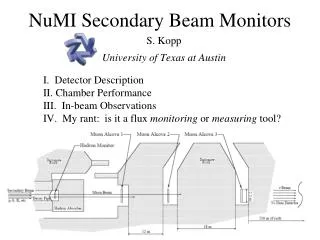
The NuMI Facility Design parameters: • 120 GeV protons from the Main Injector • 1.9 second cycle time • 4 x 10¹³ protons/pulse • 10 ms spill (single-turn extraction) • 0.4 MW E. Falk Harris, U. Sussex SNOW 2006 Stockholm
The NuMI Beam • Graphite target • Magnetic focusing horns • Target moveable relative to horn 1:continuously variable neutrino spectrum E. Falk Harris, U. Sussex SNOW 2006 Stockholm
The NuMI Beam • Currently running in the LE-10 configuration • ~ 1.5 x 10¹⁹ POT in pME and pHE configurations early in the run for commissioning and systematics studies Events expected in fiducial volume (no osc.) E. Falk Harris, U. Sussex SNOW 2006 Stockholm
First Year of Running Observation of neutrinos in Near Detector! Dataset used for the oscillation analysis Start of LE running 2.3 x 10¹³ protons/pulse averaged for 15 Oct to 31 Jan (2.2 s cycle) E. Falk Harris, U. Sussex SNOW 2006 Stockholm
1 km from target 1 kton 282 steel planes 153 scintillator planes 735 km from target 5.4 kton 484 steel/scintillator planes Near Detector Far Detector The MINOS Detectors Steel/scintillator tracking calorimeters Functionally identical Magnetised to 1.2 T GPS time-stamping to synchronise FD data to ND/beam E. Falk Harris, U. Sussex SNOW 2006 Stockholm
Detector Technology • 2.54 cm steel planes • 1 cm thick, 4 cm wide plastic scintillator strips • Orthogonal orientation on alternate planes (U, V) • Wavelength-shifting fibre-optic readout • Multi-anode PMTs M16 M64 E. Falk Harris, U. Sussex SNOW 2006 Stockholm
MINOS Calibration System • Calibration of ND and FD response using: • Light Injection system (PMT gain) • Cosmic ray muons (strip to strip and detector to detector) • Calibration detector (overall energy scale) • Energy scale calibration: • 1.9% absolute error in ND • 3.5% absolute error in FD • 3% relative E. Falk Harris, U. Sussex SNOW 2006 Stockholm
nm CC Event ne CC Event Event Topologies Monte Carlo NC Event UZ VZ 3.5m 1.8m 2.3m Short, with typical EM shower profile Long m track + hadronic activity at vertex Short event, often diffuse En = Eshower+Pm 55%/E 6% range, 10% curvature E. Falk Harris, U. Sussex SNOW 2006 Stockholm
Selecting CC Events A pure sample of nm is selected by: • Find events coincident in time with beam spill • A well-reconstructed track is found • Vertex is within fiducial region • Track curvature is consistent with negative muon • Cut on likelihood-based particle ID • Three input Probability Density Functions (PDFs):event length, fraction of event pulse height in the reconstructed track, average track pulse height per plane Muon dE/dx Event length Elasticity E. Falk Harris, U. Sussex SNOW 2006 Stockholm
CC Selection Efficiencies • Particle ID (PID) parameter: • CC-like events: PID > -0.2 in the FD (> 0.1 in the ND) • NC contamination limited to bins below 1.5 GeV • Selection efficiency quite flat as a function of visible energy Monte Carlo Monte Carlo CC-like (87%) (97%) E. Falk Harris, U. Sussex SNOW 2006 Stockholm
Near Detector Distributions • Very large event rates in the Near Detector (~107 events in the fiducial volume for 1020 POT) • High-statistics dataset: • Understand performance of Near Detector • Check level of agreement between data and Monte Carlo Reconstructed track angle with respect to vertical Distribution of reconstructed event vertices in the x-y plane Beam points down 3 degrees to reach Soudan Reconstructed y vertex (m) Fiducial region Coil hole Partially instrumented planes Detector outline Area normalised Reconstructed x vertex (m) E. Falk Harris, U. Sussex SNOW 2006 Stockholm
Particle ID Variables and PID Parameter LE-10 beam Event length Track pulse height per plane Calorimeter/ spectrometer boundary Track pulse height fraction PID parameter E. Falk Harris, U. Sussex SNOW 2006 Stockholm
Hadron Production Tuning Agreement between data and Fluka05 Beam MC pretty good, but by tuning the MC by fitting to hadronic xF and pT, improved agreement can be obtained LE-10/185kA pME/200kA pHE/200kA LE-10/Horns off Weights applied as a function of hadronic xF and pT. LE-10 events Not used in the fit E. Falk Harris, U. Sussex SNOW 2006 Stockholm
Far Detector Beam Analysis • Oscillation analysis performed using data taken in the LE-10 configuration from 20 May to 6 Dec 2005 • Total integrated POT: 0.93 x 10²⁰ • POT-weighted FD live time: 98.9% • Blind analysis • Unknown fraction of Far Detector events hidden (based on event length and total energy deposition) • “Open” set examined to confirm that there are no problems with FD data • Oscillation analyses pre-defined and validated on MC • When satisfied that FD data and analysis methods are OK:“open the box” and perform final analysis on total sample • No re-tuning of cuts allowed after box opening E. Falk Harris, U. Sussex SNOW 2006 Stockholm
Selecting Beam Events • Time-stamping of the neutrino events provided by two GPS units (located at Near and Far Detector sites) • FD spill trigger reads out 100 ms of activity around beam spills • Far Detector neutrino events easily separated from cosmic muons (0.5 Hz) using topology Time difference of neutrino interactions from beam spill Backgrounds were estimated by applying selection algorithm on “fake” triggers taken in anti-coincidence with beam spills. In 2.6 million “fake” triggers, 0 events survived the selection cuts (upper limit on background in open sample is 1.7 events at 90% C.L. ) E. Falk Harris, U. Sussex SNOW 2006 Stockholm
Predicting the Un-Oscillated FD Spectrum • Directly use the Near Detector data to perform extrapolation between Near and Far • Use Monte Carlo to provide necessary corrections due to energy smearing and acceptance • Use our knowledge of pion decay kinematics and the geometry of our beamline to predict the FD energy spectrum from the measured ND spectrum • Known as the Beam Matrix Method p+ to far Detector (stiff) target qf p+ qn (soft) Decay Pipe ND E. Falk Harris, U. Sussex SNOW 2006 Stockholm
Near to Far Extrapolation Beam matrix holds our knowledgeof two-body pion decay kinematicsand geometry E. Falk Harris, U. Sussex SNOW 2006 Stockholm
Alternative Methods to Predict FD Spectrum • Three other methods to derive FD spectrum from ND data: • Extrapolation using Far/Near ratio from MC • Fitting to ND data derive systematic parameters reweight FD MC • Two independent methods:“NDfit” and “2d Grid Fit” • Above methods have quite different sensitivities to systematic errors • Comparing results from all four provides good check of robustness of oscillation measurement Predicted FD unoscillated spectra E. Falk Harris, U. Sussex SNOW 2006 Stockholm
Vertex Distributions FD box opening 4 March 2006! • 296 selected events with a track – no evidence of background contamination • Distribution of selected events consistent with neutrino interactions (uniform distribution of event vertices) E. Falk Harris, U. Sussex SNOW 2006 Stockholm
Physics Distributions Muon momentum (GeV/c) Shower energy (GeV) y = Eshw/(Eshw+Pm) E. Falk Harris, U. Sussex SNOW 2006 Stockholm
Numbers of Events • 33% deficit of events between 0 and 30 GeV with respect to no-oscillation expectation • Rate-only significance: 5 standard deviations E. Falk Harris, U. Sussex SNOW 2006 Stockholm
Best-Fit Spectrum E. Falk Harris, U. Sussex SNOW 2006 Stockholm
Data Best-fit Ratio Data/MC E. Falk Harris, U. Sussex SNOW 2006 Stockholm
Allowed Regions E. Falk Harris, U. Sussex SNOW 2006 Stockholm
Systematic Errors Systematic shifts in the fitted parameters computed with MC “fake data” samples for Dm2 = 0.003 eV2, sin2 2q = 0.9: E. Falk Harris, U. Sussex SNOW 2006 Stockholm
m2 = 0.003 eV2 Projected Sensitivity Improve this measurement: Sensitivity at 16 x 1020 POT Search for sub-dominant νμνeoscillations • Study neutrino/anti-neutrino oscillations • Search for/rule out exotic phenomena: • Sterile neutrinos, neutrino decay E. Falk Harris, U. Sussex SNOW 2006 Stockholm
Summary and Conclusions • MINOS has performed a preliminary oscillation analysis of 0.93 x 10²⁰ protons on target • No disappearance disfavoured at 5.8s (shape + rate); 5s (rate only) • Consistent with n oscillation results, with parameters: • Measurement is statistically limited; systematics under control • Significant improvements expected with more data • Total exposure to date: 1.4 x 10²⁰ POT E. Falk Harris, U. Sussex SNOW 2006 Stockholm
Backup slides E. Falk Harris, U. Sussex SNOW 2006 Stockholm
Overview of the Oscillation Measurement • In order to perform the oscillation analysis, we need to predict the neutrino beam spectrum seen by the Far Detector in the absence of oscillations • Want to minimise uncertainties related to beam modelling and cross-sections (nominal values are built-in to our Monte Carlo) • Use the Near Detector data to correct the nominal Monte Carlo • Beam spectrum • Neutrino cross-sections E. Falk Harris, U. Sussex SNOW 2006 Stockholm
Current Knowledge of Atmospheric Neutrino Oscillations • Current best measurements of Dm223 and sin2 2q23 from Super-Kamiokande (atmospheric neutrino analysis) and K2K (9x10¹⁹ pot) • The limits (at 90% C.L.) are: • sin2 2q > 0.9 • 1.9 < Dm2 < 3.0 10-3 eV2 • This analysis is for 9.3 x 10¹⁹ POT, and should provide a competitive measurement of the mixing parameters Allowed regions from Super-K and K2K E. Falk Harris, U. Sussex SNOW 2006 Stockholm
Calorimeter Spectrometer ν ν Event Selection Cuts nm CC-like events: • Event must contain at least one good reconstructed track • Reconstructed track vertex within fiducial volume of detector Near Detector:1 m < z < 5 m (from detector front),R < 1 m from beam centre Far Detector:z > 50 cm from front face,z > 2 m from rear face,R < 3.7 m from detector centre • Fitted track should have negative charge (selects nm) • Separation of CC from NC events:cut on likelihood-based Particle ID parameter E. Falk Harris, U. Sussex SNOW 2006 Stockholm
Selecting CC Events • Events selected by likelihood-based procedure Three input probability density functions (PDFs): • Event length in planes • Fraction of event pulse height in the reconstructed track • Average track pulse height per plane • Define Pm (PNC) as the product of the three CC (NC) PDFs, at the values of these variables taken by the event E. Falk Harris, U. Sussex SNOW 2006 Stockholm
Near detector rate and event vertices – LE-10 beam • Event rate is flat as a function of time • Horn current scans – July 29 – Aug 3 Y Z X E. Falk Harris, U. Sussex SNOW 2006 Stockholm
June • July • August • September • October • November Stability of Energy Spectrum & Reconstruction with Intensity Proton intensity ranges from 1e13 ppp to 2.8e13 ppp Energy spectrum by month Energy spectrum by batch • Reconstructed energy distributions agree to within statistical uncertainties (~1-3%) • Beam is very stable and there are no significant intensity-dependent biases in event reconstruction E. Falk Harris, U. Sussex SNOW 2006 Stockholm
Summary of ND Data/MC Agreement • No obvious pathologies introduced by detector modelling and/or reconstruction • Agreement between high-level quantities is within expected systematic uncertainties from cross-section modelling, beam modelling and calibration uncertainties • Initial agreement improved after applying beam reweighting on the xF and pT of parent hadrons in the Monte Carlo E. Falk Harris, U. Sussex SNOW 2006 Stockholm
Higher than nominal FD MC in high-energy tail Expected, given that the ND spectrum is also higher than the nominal MC in this region Predicted True FD Spectrum Predicted FD true spectrum from the Beam Matrix Method E. Falk Harris, U. Sussex SNOW 2006 Stockholm
Far Detector Beam Analysis Oscillation analysis performed using data taken in the LE-10 configuration from 20 May to 6 Dec 2005 • Total integrated POT: 0.93 x 10²⁰ • Excluded periods of “bad data”: coil and HV trips, periods without accurate GPS timestamps • Effect of these cuts is small: ~0.7% of total POT • POT-weighted live-time of the Far Detector: 98.9% E. Falk Harris, U. Sussex SNOW 2006 Stockholm
Blind Analysis • Blind-analysis policy for the first accelerator-neutrino results • Unknown fraction of Far Detector events hidden (based on event length and total energy deposition) • No blinding of Near Detector data • Unknown fraction of Far Detector data open • Performed extensive data quality checks • Unblinding criteria: • No problems with the Far Detector beam dataset (missing events, reconstruction problems, etc.) • Oscillation analysis (cuts and fitting procedures) pre-defined and validated on MC; no re-tuning of cuts allowed after box opening E. Falk Harris, U. Sussex SNOW 2006 Stockholm
Particle ID Variables (LE-10 Beam) Event length Track PH per plane Calorimeter/ spectrometer boundary Track PH fraction E. Falk Harris, U. Sussex SNOW 2006 Stockholm
PID Parameter LE-10 pME PID cut to select CC-like events is at –0.1 pHE E. Falk Harris, U. Sussex SNOW 2006 Stockholm
Energy Spectra & Ratios (CC-like events) Reconstructed energy (GeV) pME pHE LE-10 pHE pME LE-10 Error envelopes shown on the plots reflect uncertainties due to cross-section modelling, beam modelling and calibration uncertainties E. Falk Harris, U. Sussex SNOW 2006 Stockholm
Box Opening • Collaboration agreed on 4 March 2006 to open the box • Sufficient confidence in FD data • Analysis methods fully validated on MC datasets Far Detector Data (full dataset) E. Falk Harris, U. Sussex SNOW 2006 Stockholm
Track Quantities and PID Parameter Track pulse height per plane Track length Particle identification parameter E. Falk Harris, U. Sussex SNOW 2006 Stockholm
Track Angles X Y Notice that beam is pointing 3 degrees up at Soudan! Z E. Falk Harris, U. Sussex SNOW 2006 Stockholm
Breakdown of Selected Events E. Falk Harris, U. Sussex SNOW 2006 Stockholm