Download
1 / 43
430 likes | 566 Vues
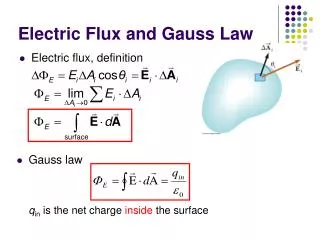
Using a Global Flux Network—FLUXNET— to Study the Breathing of the Terrestrial Biosphere. Dennis Baldocchi ESPM/Ecosystem Science Div. University of California, Berkeley Collaborators

E N D
Using a Global Flux Network—FLUXNET— to Study the Breathing of the Terrestrial Biosphere Dennis Baldocchi ESPM/Ecosystem Science Div. University of California, Berkeley Collaborators Rodrigo Vargas, Youngryel Ryu, Markus Reichstein, Dario Papale, Andrew Richardson, Deb Agarwal Catharine van Ingen, Bob Cook and Regional Networks ILEAPS 2009 Melbourne, Australia
Objectives • Network Background • Statistical Representativeness • Global Statistics on NEE, GPP, Reco • Network Size • Is the Statistical Distribution of Carbon Fluxes Invariant at the Global Scale? • Emergent Processes • Coupling between Photosynthesis and Respiration • PhotoDegradation, a New Process to Consider • Fluxes and Phenology • Space • Regional Flux Maps • Phenology Greenwave
Eddy Covariance Technique • Direct • In situ • Quasi-Continuous • Extended Footprint
FLUXNET DataBase • Web sites • www.fluxnet.ornl.gov/fluxnet/index.cfm • www.fluxdata.org • QA/QC • Data Standardization (names, units) • Version Control • Derived Flux Quantities • Gap-Filling • U* corrections for periods of low turbulence • Daily, Monthly, Annual Integrals • Flux Partitioning • Converting NEE into GPP and Reco • Compiling Multifaceted Site MetaData • Data Distribution • Search/Manipulate/Archive
Standard Processing Procedure Vs non-standard, but Expert Based
Over-Arching Questions relating to Statistical Representativeness • As the sparse Network has grown, can it provide a Statistically-Representative sample of NEE, GPP and Reco to infer Global Behavior?, e.g. Polls sample only a small fraction of the population to generate political opinion • If mean Solar inputs and Climate conditions are invariant, on an annual and global basis,are NEE, GPP and Reco constant, too?; e.g. global GPP scales with solar radiation which is constant • Can Processes derived from a Sparse-Network be Upscaled with Remote Sensing and Climate Maps?; e.g. We don’t need to be everywhere all the time; We can use Bayes Theorem and climate records to upscale.
Global distribution of Flux Towers Covers Climate Space Well Can we Integrate Fluxes across Climate Space, Rather than Cartesian Space?
Apply Bayes Theorem to FLUXNET? p(flux) from FLUXNET p(climate|flux) prior from FLUXNET p(climate) from climate database Estimate Global flux by Integrating p(Flux|climate) across Globally-gridded Climate space
Probability Distribution of Published NEE Measurements, Integrated Annually Baldocchi, Austral J Botany, 2008
Updated PDF with 164 extra site-years yields an insignificant change in the mean (P= 0.68)
Upscaling Flux Data with Remote Sensing Data Published, Global: -182 gC m-2 y-1 Map, US: -189 gC m-2 y-1 Xiao and Baldocchi, unpublished
How many Towers are needed to estimate mean NEE, And assess Interannual Variability, at the Global Scale? We Need about 75 towers to produce robust Statistics
Little Change in Abiotic Drivers--annual Rg, ppt --across Network
Interannual Variability in NEE is small (between -220 to -243 gC m-2 y-1) across the Global Network
Interannual Variability in GPP is small, too, across the Global Network (1103 to 1162 gC m-2 y-1)
Potential and Real Rates of Gross Carbon Uptake by Vegetation: Most Locations Never Reach Upper Potential GPP at 2% efficiency and 365 day Growing Season tropics GPP at 2% efficiency and 182.5 day Growing Season FLUXNET 2007 Database
Does Net Ecosystem Carbon Exchange Scale with Photosynthesis? Ecosystems with greatest GPP don’t necessarily experience greatest NEE Baldocchi, Austral J Botany, 2008
Ecosystem Respiration Scales Tightly with Ecosystem Photosynthesis, But Is with Offset by Disturbance Baldocchi, Austral J Botany, 2008
Decadal Plus Time Series of NEE:Flux version of the Keeling’s Mauna Loa Graph Data of Wofsy, Munger, Goulden, et al.
Interannual Variation and Long Term Trends in Net Ecosystem Carbon Exchange (FN), Photosynthesis (FA) and Respiration (FR) Urbanski et al 2007 JGR
Interannual Variations in Photosynthesis and Respiration are Coupled Baldocchi, Austral J Botany, 2008
What Happens to the Grass? June October
PhotoDegradation is a New and Emerging Process Affecting C Cycle in Semi-arid Grasslands Baldocchi and Ma, unpublished
PhotoDegradation: A Process Not in Coupled Carbon-Climate Models Baldocchi, Ma, Rutledge, unpublished
More Carbon is Lost with Rain Pulse on Dry Matter that has Been PhotoDegraded than Dry Matter in the Shade Xu, Baldocchi, Tang, 2004 Global Biogeochem Cycles
Seasonality in GPP follows NDVI and Defines Growing Season Ryu et al. in prep
Net Ecosystem Carbon Exchange Scales with Length of Growing Season Baldocchi, Austral J Botany, 2008
Soil Temperature: An Objective Indicator of Phenology?? Data of Pilegaard et al.
Soil Temperature: An Objective Measure of Phenology, part 2 Baldocchi et al. Int J. Biomet, 2005
Spatialize Phenology with Transformation Using Climate Map Baldocchi, unpublished
Flux Based Phenology Patterns with Match well with data from Phenology Network White, Baldocchi and Schwartz, unpublished
Do Snap-Shot C Fluxes, inferred from Remote Sensing, Relate to Daily C Flux Integrals? Sims et al 2005 AgForMet
Spatial Variations in C Fluxes spring summer autumn winter Xiao et al. 2008, AgForMet
Conclusions • A sparse Global Network of Flux Towers produces statistically robust findings that are representative of broad climate and ecological zones that may integrated to validate models at grid/landscape/regional scales • Any Statistical Scaling Approach based on Climate must consider Disturbance and Stand Age, too. • A global Network of Flux Towers is discovering a number of emergent scale processes relating to the controls in inter-annual variability, controls by light, and phenology
Acknowledgments • NSF, Research Coordinated Networks • Microsoft, Regional Networks, ILEAPS • World-wide Collection of Collaborators and Colleagues, Technicians, Postdocs and Students
ANOVA analysis of the annual sums A. Richardson & D. Baldocchi, unpublished