Download
1 / 12
120 likes | 223 Vues
Analyses PLAN and PSAT Score Results Fall 2012. PSAT/NMSQT. PLAN - Fall 2012 - 11th Grade LHS v. National . PLAN - Fall 2012 - 10th Grade LHS v. National . PLAN (Fall 2012) 10 th and 11 th Grades Comparison with National Averages. Analysis Overview 2012 PLAN Scores

E N D
AnalysesPLAN and PSAT Score ResultsFall 2012 PSAT/NMSQT
PLAN (Fall 2012)10th and 11th Grades Comparison with National Averages
Analysis Overview • 2012 PLAN Scores • PLAN is the pre-ACT. Scores on the PLAN are not publically available. Results of PLAN testing are used to help students, parents and teachers develop a plan to prepare students for taking the ACT by the spring of the junior year. • Luella High School tested 464 tenth grade students in October 2012. • 10th graders from this year’s testing scored similar to the national average scores both in the composite score and the 4 individual tests: English; Math; Reading; Science. • However, Luella student scores did not meet or exceed the national average scores in any of the 5 areas. • Luella High School tested 190 eleventh grade students in October 2012. • 11th graders from this year’s testing scored ABOVE the national average scores in all 5 areas. • Presently scores from previous years are unavailable; therefore, historical nor longitudinal analyses are possible.
PSAT (11th Grade Class) 2012 & 2011LHS v. State & National Avg
PSAT (Fall 2012 & 2011)LHS 11th Grade (each year)Comparison with State and National Averages
PSAT (10th Grade Class)2011 & 2012LHS v. State & National Avg.
PSAT (Fall 2012 & 2011)LHS 10th Grade (each year)Comparison with State and National Averages
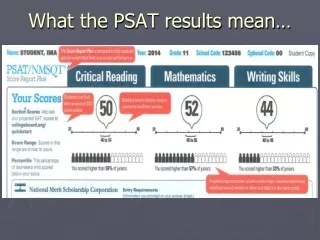
Analysis Overview • 2012 PSAT Scores • PSATis the pre-SAT. Scores on the PSAT are not publically available. Results of PSAT testing are used to help students, parents and teachers develop a plan to prepare students for taking the SAT by the spring of the junior year. • Luella High School tested 473 tenth grade students in October 2012. • 10th graders from this year’s testing scored below both state and national average scores in all three areas: Critical Reading; Math; Writing Skills, as was the case for the PSAT administered in 2011. • Luella High School tested 219 eleventh grade students in October 2012. • 11th graders from this year’s testing scored below both state and national average scores in all three areas: Critical Reading; Math; Writing Skills, as was the case for the PSAT administered in 2011. • The gap between LHS scores and national averages in Critical Reading and Writing Skills in both instances was less than 1 point with the gap in math being slightly over 2 points. • With historical data being available, some historical data are presented; however, since these data compare different classes, relevance is difficult to establish in such comparisons.
Analysis Overview • 2012 PSAT Scores • Longitudinal analysis does provide some indication of growth for students in the same class, the Class of 2014. Data for these students were compared for Fall 2011 and Fall 2012. Then these data were compared to state and national averages for growth as well. • In Critical Reading, growth between the 2011 and 2012 exceeded the growth nationally and approached the growth in State of Georgia averages. • In Math, growth between the 2011 and 2012 exceeded the growth nationally, yet still lagged from growth in State of Georgia averages. • In Writing Skills, growth between the 2011 and 2012 exceeded the growth nationally and approached the growth in State of Georgia averages. • Testing results will be used to assist students in preparing for the ACT and SAT. Analyses of sub-test results will be used to help teachers and departments in planning improvements to instruction. • Our goals continue to be: each student maximizing her/his PLAN/ACT; PSAT/SAT scores and as a school, meeting and exceeding consistently both state and national averages.