Download
1 / 36
390 likes | 697 Vues
CTS: Clinical Assessment of COPD. Adapted from Can Respir J January/February 2008;15(suppl A). CTS: Potential Prevention Strategies for AECOPD. Adapted from Can Respir J January/February 2008;15(suppl A). CTS: Comprehensive Approach to COPD/AECOPD Management. Surgery. Oxygen.

E N D
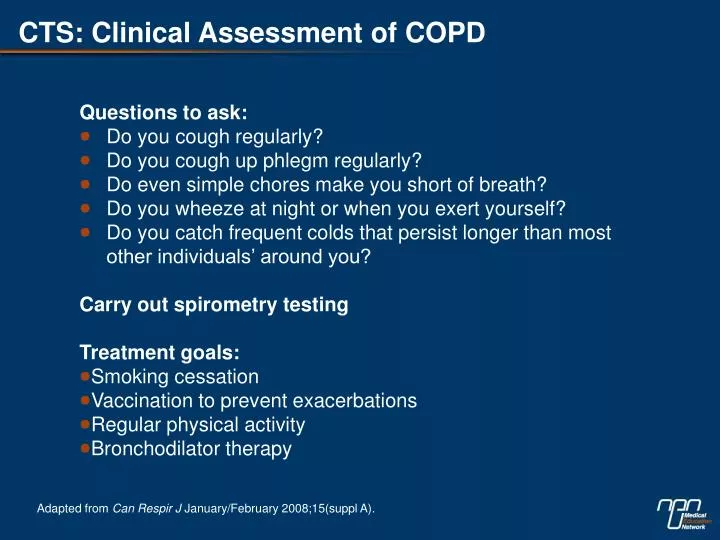
CTS: Clinical Assessment of COPD Adapted from Can Respir J January/February 2008;15(suppl A).
CTS: Potential Prevention Strategies for AECOPD Adapted from Can Respir J January/February 2008;15(suppl A).
CTS: Comprehensive Approach to COPD/AECOPD Management Surgery Oxygen Inhaled corticosteroids/LABA Pulmonary rehabilitation Long-acting bronchodilator(s) PRN short-acting bronchodilator(s) Smoking cessation/exercise/self-management/education Verysevere Mild Lung function impairment II V MRC dyspnea scale Early diagnosis (spirometry) + prevention Prevent/Rx AECOPD End-of-life care Follow-up Adapted from Can Respir J January/February 2008;15(suppl A).
CTS: Recommendations for Optimal COPD Therapy Increasing Disability and Lung Function Impairment Mild Moderate Severe Infrequent AECOPD (an average of <1 per year) Frequent AECOPD (≥1 per year) LAAC or LABA + SABA prn SABA prn LAAC + ICS/LABA + SABA prn persistent disability persistent disability persistent disability LAAC + LABA + SABA prn LAAC + ICS/LABA + SABA prn ± Theophylline LAAC + SABA prn or LABA + SABD prn persistent disability LAAC+ICS/LABA* +SABA prn *Refers to the lower-dose ICS/LABA. Adapted from Can Respir J January/February 2008;15(suppl A).
Clinical Differences Between Asthma and COPD Adapted from Can Respir J January/February 2008;15(suppl A).
MRC Dyspnea Scale Adapted from Can Respir J January/February 2008;15(suppl A).
2020 1990 Ischaemic heart disease Cardiovascular disease Lower respiratory infection Diarrheal disease Perinatal disorders COPD Tuberculosis Measles Road traffic accident Lung cancer Ischemic heart disease Cardiovasculardisease COPD Lower respiratory infection Lung cancer Road traffic accident Tuberculosis Stomach cancer HIV Suicide 1st 2nd 3rd 4th 5th 6th 7th 8th 9th 10th COPD Is Projected to Be the Third Biggest Cause of Mortality by 2020 Adapted from Murray CJ, Lopez AD. Lancet 1997;349:1498-504.
Inflammation Plays a Central Role in the Pathogenesis and Pathology of COPD Cigarette smoke (and other irritants) Genetic susceptibility • Inflammatory cells • Inflammatory mediators • Oxidative stress • Proteases Lung Inflammation COPD pathology Mucus hypersecretion Alveolar wall destruction Obstructive bronchiolitis Adapted from Global Initiative for Chronic Obstructive Lung Disease (GOLD) Guidelines, 2006. Available at http://www.goldcopd.com/
++++ +++ ++ Inflammation + 0 Exacerbation Non-smokers Severe COPD Mild COPD Normal smokers Amplification of Inflammation in COPD Bacteria Viruses • Inflammatory cells • Cytokines • Mediators • Proteases Adapted from Barnes PJ. Personal Communication.
Complementary Effect of ICS/LABA on COPD Inflammation CD8+ T-lymphocytes Eosinophils 20 8 0 6 –20 4 0.87 (3.9 to 5.6) –40 2 -44.67 (-90.9 to 1.6) -53.4 (-96 to -9) –60 0 Treatment difference (95% CI) Treatment difference (95% CI) –80 –2 -3.1 (-8.0 to 1.8) -98.05 (-143.1 to -53.0) –100 –4 -3.97 (-9 to 1.1) –120 –6 –140 –8 –160 –10 40 CD68+ macrophages Neutrophils 40 30 30 20 20 18.21 (4.8 to 31.6) 10 0 10 -2.32 (-32.5 to 27.8) –10 Treatment difference (95% CI) 0 Treatment difference (95% CI) –20 -4.57 (-17.6 to 8.5) -29.36 (-57.8 to -0.9) –10 –30 -31.68 (-61.1 to -2.3) –40 –20 -22.78 (-35.4 to -10.2) –50 –30 –60 –40 –70 SFC-FP SFC-P FP-P SFC-FP SFC-P FP-P SFC-FP=salmeterol/fluticasone DPI vs. fluticasone DPI SFC-P=salmeterol/fluticasone DPI vs. placebo; FP-P=fluticasone DPI vs. placebo Adapted from Bourbeau et al. Thorax 2007;Epub.
COPD exacerbations lead to: Decline in lung function1 Increased symptoms (breathlessness)2 Worsening health status3 Increased risk of hospitalization4 Increased risk of mortality4,5 Exacerbations Drive Morbidity and Mortality 1. Donaldson et al. Thorax 2002;57:847-52. 2 Donaldson et al. Eur Respir J 2003;22:931-6. 3. Seemungal et al. Am J Respir Crit Care Med 1998;157:1418-22. 4. Groenewegen et al. Chest 2003;124:459-67. 5. Soler-Cataluna et al. Thorax 2005;60:925-31.
100 80 60 40 20 0 Seemungal et al.1(n=184)1 Wilkinson et al.2(n=1099)2 Patients Under-report COPD Exacerbations Unreported exacerbations Reported exacerbations Exacerbations (%) 40.1 49.5 59.9 59.9 50.5 1. Seemungal et al. Am J Respir Crit Care Med 1998;157:1418-22.2. Wilkinson et al. Am J Respir Crit Care Med 2004;169:1298-303.
GOLD Guidelines Adapted from GOLD (December 2007).
Longer intervals between flare-ups 40 Fewer side effects 36 Better ability to cope with daily chores 27 Lower costs of treatment 27 Better doses 23 0 10 20 30 40 50 60 What do COPD patients with a history of exacerbations want from their therapy? Quicker symptom relief 55 Patients (%) Results from 1100 interviews in five EU countries and the USA Adapted from Miravitlles et al. Respir Med 2007;101:453-60.
Frequent exacerbations 0.95 Infrequent exacerbations 0.90 FEV1 (l) 0.85 0.80 0.75 0 1 2 3 4 Time (years) Frequent Exacerbations Lead to Declining Lung Function Frequent: >median 2.92 exacerbations/yearInfrequent: ≤median 2.92 exacerbations/yearFEV1: forced expiratory volume in 1 second Adapted from Donaldson et al. Thorax 2002;57:847-52.
0 10 20 30 40 50 60 Increased Frequency of Exacerbations Increases the Risk of Mortality in COPD 0 exacerbations 1–2 exacerbations ≥3 exacerbations 1.0 0.8 P<0.0002 0.6 Survival probability P<0.0001 0.4 P=0.069 0.2 0 Time (months) Adapted from Soler-Cataluna et al. Thorax 2005;60:925-31.
Bud/form Formoterol 1.0 1.0 Budesonide 0.9 0.9 Placebo Placebo 0.8 0.8 0.7 0.7 178 days 178 days Fraction of patients without an exacerbation during the study Fraction of patients without an exacerbation during the study 254 days 254 days 0.6 0.6 0.5 0.5 0.4 0.4 96 days 96 days 154 days 154 days 0.3 0.3 0 0 0 0 40 40 80 80 120 120 160 160 200 200 240 240 280 280 320 320 360 360 400 400 Time in study (days) Time in study (days) Prolonged Time to First Exacerbation P<0.05 Busesonide/formoterol (bud/form) vs. all other groups (log-rank test) Budesonide/formoterol prolonged time to first exacerbation by 100 days vs. LABA alone Adapted from Calverley et al. Eur Respir J 2003;22:912-9.
Active reduction of risk factor(s); influenza vaccination Addshort-acting bronchodilator (when needed) Addregular treatment with one or more long-acting bronchodilators (when needed); addrehabilitation Add inhaled glucocorticosteroids if repeated exacerbations Addlong-term oxygenif chronic respiratory failure Considersurgical treatments I: Mild II: Moderate III: Severe IV: Very Severe FVC = forced vital capacity Adapted from Global Initiative for Chronic Obstructive Lung Disease (GOLD) Guidelines, 2006. Available from http://www.goldcopd.com/
Budesonide/formoterol1 Budesonide/formoterol2 Salmeterol/ fluticasone DPI3 Salmeterol/ fluticasone DPI4 Improvements in Health Status by ICS/LABA Combinations vs. Placebo –8 –7 –6 –5 Clinically meaningful improvement ∆ Health status –4 –3 –2 –1 0 *Measured by using the St. Georges Respiratory Questionnaire, a validated tool for measuring health status in COPD 1. Calverley et al. Eur Respir J 2003;22:912-9 2. Szafranski et al. Eur Respir J 2003;21:74-81. 3. Calverley et al. Lancet 2003;361:449-56. 4. Calverley et al. N Engl J Med 2007;356:775-89.
ICS/LABA ICS LABA 0 –5 –10 -10% –15 -16% Risk of rehospitalization or death vs. reference patients (%) –20 –25 –30 –35 –40 -41% –45 ICS/LABA Improves Hospitalization-free Survival in a Cohort Study P<0.05 ICS/LABA vs. ICS or LABARetrospective cohort analysis of COPD-related rehospitalization or death within one year of first hospitalization in 3636 COPD patients receiving ICS and/or LABA compared with 627 reference patients receiving SABA alone Adapted from Soriano et al. Am J Respir Med 2003;2:67-74.
ICS/LABA Improves Overall Survivalin a Cohort Study 1.00 ICS/LABA LABA 0.95 ICS SABA 0.90 0.85 Survival function estimate* 66% lower relative risk for all-cause mortality 0.80 Hazard ratio: 0.34*(95% CI, 0.21-0.56)P<0.001 0.75 0.70 0 200 400 600 800 1200 1000 Survival (days) *Adjusted for age, gender, ICS treatment, LABA treatment, ICS plus LABA treatment, asthma diagnosis, measures of COPD severity at baseline, measures of asthma severity at baseline, hospitalization for respiratory illnesses, and both inpatient and outpatient Charlson–Deyo scores; n=1685 Adapted from Mapel et al. Respir Med 2006;100:595-609.
0.10 Non-budesonide 0.08 Budesonide Log-rank test: P=0.0365Cox regression: hazard ratio, 0.564; P=0.0391 0.06 Proportion of patients who died 34/917 0.04 22/917 0.02 0 0 40 80 120 160 200 240 280 320 360 400 Time in study (days) Improved Survival with Budesonide +/– Formoterol Compared to Bronchodilator Treatment Alone Adapted from Calverley et al. COPDV 2006.
Budesonide/formoterol: Maintained Improvement in Lung Function vs. LABA Alone Mean FEV1 (% of baseline) Bud/form 104 Formoterol 102 Budesonide 100 Placebo 98 96 94 92 90 88 86 84 82 80 –0.5 0 1 2 3 4 6 7 8 9 10 11 12 5 Time from randomization (months) P<0.001 Budesonide/formoterol (bud/form) vs. placebo and budesonide P=0.002 Budesonide/formoterol vs. formoterol; P<0.001 formoterol vs. placebo Calverley et al. Eur Respir J 2003;22:912-9.
+3% –12% Reduced Rate of Exacerbations Requiring Medical Intervention vs. LABA Alone 5 Rate of exacerbations/patient/year 0 3 –5 2.1 2 –10 Number needed to treat –15 1 –20 0 –25 –24% * Budesonide/ formoterol vs. formoterol –30 Bud/form Budesonide Formoterol • Treating 100 patients with COPD (GOLD stage III–IV) with budesonide/formoterol instead of formoterol alone may prevent 47 exacerbations in one year *P<0.05 vs. placebo;P=0.015 budesonide/formoterol (bud/form) vs. formoterol Adapted from Calverley et al. Eur Respir J 2003;22:912-9.
Lower SGRQ total score (≤60) Higher SGRQ total score (>60) 100 75 P=0.0002 50 Survival (%) 25 0 0 200 400 600 800 Observation time (days) Lower Health Status Predicts Mortality SGRQ=St. George’s Respiratory QuestionnaireHigher health status=SGRQ total score ≤60; lower health status=SGRQ total score >60 Adapted from Gudmundsson et al. Respir Res 2006;7:109.
Budesonide Non-budesonide Mortality Stratified by Median Baseline SGRQ Total Score 0.10 0.08 SGRQ total score >50 0.06 Proportion of patients who died 0.04 SGRG total score >50 SGRQ total score≤50 0.02 SGRQ total score≤50 0 0 40 80 120 160 200 240 280 320 360 400 Time in study (days) Stratified by SGRQ total score, median 50-unit cut-off Adapted from Calverley et al. COPDV 2006.
Special intervention group Usual care group Impact of Smoking Cessation Programmes on Mortality 1.00 0.95 0.90 0.85 0.80 Proportion of patients with no event 15% 0 1 2 3 4 5 6 7 8 9 10 11 12 13 14 15 Time since LHS baseline (years) • All-cause 14.5-year survival from the Lung Health Study (LHS) Adapted from Anthonisen et al. Ann Intern Med 2005;142:233-9.
1.0 ICS No ICS 0.9 Hazard ratio: 0.74(95% CI, 0.71-0.78) 0.8 COPD hospitalization-free survival probability 0.7 26% lower relative risk for all-cause mortality and repeat hospitalization 0.6 0 0 2 4 6 8 10 12 14 Time after discharge (months) ICS Improve Hospitalization-free Survivalin a Cohort Study Adapted from Sin et al. Am J Respir Crit Care Med 2001;164:580-4.
1.00 ICS Placebo 27% lower relative risk for All-cause mortality 0.95 0.90 Hazard ratio: 0.73*(95% CI, 0.55-0.96)P=0.039 Survival probability 0.85 0.80 0 1 2 3 4 Follow-up (years) ISEEC Study: ICS Improve Survival ISEEC=Inhaled Steroids Effects Evaluation in COPD *Stratified by individual trials and adjusted for age, gender, baseline post-bronchodilator FEV1 (% predicted normal), baseline smoking status and body mass index; n=5085 Adapted from Sin et al. Thorax 2005;60:992-7.
Run-in Randomization* Treatment Budesonide 400 µg b.i.d. (n=634) Placebo (n=643) Month –6 0 12 24 36 EUROSCOP Study Design • Primary end point: change over time in FEV1 • Patients: aged 30-65 years, current smokers (smoking history of • ≥5 pack-years), FEV1 50-100% predicted normal, FEV1/VC <70% *Patients who continued to smoke after two three-month smoking cessation programmes and were ≥75% compliant with the recommended treatment regimens were randomized. VC=vital capacity Adapted from Pauwels et al. N Engl J Med 1999;340:1948-53.
Run-in Randomization Treatment Follow-up Salmeterol/fluticasone DPI 50/500 µg b.i.d. Fluticasone DPI 500 µg b.i.d. Salmeterol DPI 50 µg b.i.d. Placebo Salbutamol available as reliever medication to all patients 36.5 –0.5 0 24 12 36 TORCH: Further Evidence that ICS/LABA Can Reduce Mortality in COPD Month • Primary end point: all-cause mortality over three years Adapted from: Vestbo et al. Eur Respir J 2004;24:206-10.Calverley et al. N Engl J Med 2007;356:775-89.
Salmeterol/fluticasone DPI (12.6% mortality rate) 18 Placebo (15.2% mortality rate) 16 14 12 HR 0.825, P=0.05217.5% risk reduction2.6% absolute reduction 10 Probability of death (%) 8 6 4 2 0 0 12 24 36 48 60 72 84 96 108 120 132 144 156 Time to death (weeks) Number of patientsalive: Placebo 1524 1464 1399 1293 Salmeterol/fluticasone DPI 1533 1487 1426 1339 TORCH: All-cause Mortality at Three Years Vertical bars represent standard errors Adapted from Calverley et al. N Engl J Med 2007;356:775-89.
SAL/FP 500/50 FP Placebo SAL Health Related QOL Over 3 Years - TORCH P<0.001 SAL/FP vs. Placebo over 3 years P<0.001 SAL/FP vs. SAL over 3 years 3 P=0.017 SAL/FP vs. FP over 3 years 2 1 0 Adjusted mean change in SGRQ total score -1 -2 Improvement -3 -4 -5 156 0 24 48 72 96 120 Week Vertical bars represent standard errors Adapted from Calverley et al. N Engl J Med 2007;356:775-89.
Improvements in Post Bronchodilator FEV1with SAL/FP 500/50 over 3 years - TORCH P< 0.001 SAL/FP vs. Placebo over 3 years P< 0.001 SAL/FP vs. SAL and FP over 3 years SAL/FP 500/50 Placebo FP SAL 100 Rate of decline (mL /yr) -55 -42 -42 -39 P-value vs. placebo 50 0.003 0.003 <0.001 0 Adjusted Mean Change FEV1 (mL) -50 -100 -150 0 24 48 72 96 120 156 Time (Weeks) SAL/FP 500/50 FP Placebo SAL Adapted from Calverley et al. N Engl J Med 2007; 356: 775-89.
Rationale for TORCH: ICS with LABA Probability of survival Survival was significantly higher at year 3 in patients receiving SAL/FPthan in the reference group 1.0 0.9 0.8 1045 0.7 SAL + FP FP 3620 SAL 0.6 Reference (no ICS or LABA) 0 0 6 12 18 24 30 36 Follow-up (months) SAL/FP=salmeterol/fluticasone Adapted from Soriano et al. Eur Respir J 2002;20(4):819-25.