Download
1 / 28
280 likes | 286 Vues
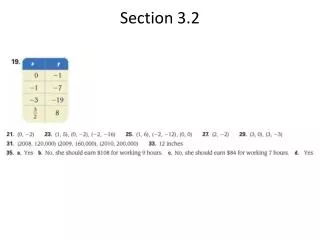
Section 3.2. Graphing Linear Equations Using Intercepts. Objective 1. Use a graph to identify intercepts. Linear Functions. straight lines when graphed, as long as A and B are not both zero . Such an equation is called the standard form of the equation of the line .

E N D
Section 3.2 • Graphing Linear Equations • Using Intercepts
Objective 1 • Use a graph to identify intercepts.
Linear Functions • straight lines when graphed, as long as A and B are not both zero. • Such an equation is called the standard form of the equation of the line. • To graph equations of this form, two very important points are used – the intercepts.
x-intercept An x-intercept of a graph is the x-coordinate of a point where the graph intersects the x-axis. The y-coordinate corresponding to an x-intercept is always zero. The graph of crosses the x-axis at (2, 0) and that point is the x-intercept.
y-intercept The y-intercept of a graph is the y-coordinate of a point where the graph intersects the y-axis. The x-coordinate corresponding to a y-intercept is always zero. The graph of crosses the y-axis at (0, 4) and that point is the y-intercept.
Objective 1: Examples 1a.Identify the x- and y-intercepts: The graph crosses the x-axis at (3,0). Thus, the x-intercept is 3. The graph crosses the y-axis at (0,5). Thus, the y-intercept is 5.
Objective 1: Examples 1b.Identify the x- and y- intercepts: The graph crosses the x-axis at (0,0). Thus, the x-intercept is 0. The graph crosses the y-axis at (0,0). Thus, the y-intercept is 0.
Objective 2 • Graph a linear equation in two variables • using intercepts.
Example Graph the equation using intercepts. Find the x-intercept. Let y 0 and then solve for x. Replace y with 0. Multiply and simplify. Divide by 2. The x-intercept is 6, so the line passes through (6,0).
Example (cont) Find the y-intercept. Let x 0 and then solve for y. Replace xwith 0. Multiply and simplify. Divide by 4. The y-intercept is 3, so the line passes through (0,3).
Example (cont) Find a checkpoint, a third ordered-pair solution. For our checkpoint, we will let x1 (because x1 is not the x-intercept) and find the corresponding value for y. Replace x with 1. Multiply. Add 2 to both sides. Divide by 4 and simplify. The checkpoint is the ordered pair (1, 3.5).
Example (cont) Graph the equation by drawing a linethrough points. The three points in the figure below lie along same line. Drawing a line through the three points results in the graph of
Example • 1. Find the x-intercept. Let y0 and solve for x. • The x-intercept is 4. The line passes through (4, 0). • 2. Find the y-intercept. Let x0 and solve for y. • The y-intercept is 3. The line passes through (0, 3).
Example (cont) • 3. Find a checkpoint, a third ordered-pairsolution. Let x2. • A checkpoint is the ordered pair (2, 1.5).
Example (cont) • 4. Find a equation by drawing a line through the intercepts and checkpoint.
Objective 2: Examples 2a.Find the x-intercept of the graph of To find the x-intercept, let y 0 and solve for x. The x-intercept is 3.
Objective 2: Examples 2b. Find the y-intercept of the graph of To find the y-intercept, let x0 and solve for y. The y-intercept is 4.
Objective 2: Examples • Find the x-intercept. Let y0 and solve for x. • The x-intercept is 3. • Find the y-intercept. Let x 0 and solve for y. • The y-intercept is 2.
Objective 2: Examples(cont) • Find a checkpoint. For example, let x 1 and solve for y.
Objective 2: Examples Because the constant on the right is 0, the graph passes through the origin. The x- and y-intercepts are both 0. Thus we will need to find two more points. Let y1 and solve for x.
Objective 2: Examples(cont) • Let y 1 and solve for x. • Use these three solutions of (0,0), (3,1), and ( 3,1).
Objective 3 • Graph horizontal or vertical lines.
Example • Graph the linear equation: y -4 • All ordered pairs that are solutions of y-4 have a value of y that is always -4. Any value can be used for x. Let’s select three of the possible values for x: -3, 1, 6. (1, -4) (-3, -4) (6,-4)
Example • Graph the linear equation: x 5 • All ordered pairs that are solutions of x 5 have a value of x that is always 5. Any value can be used for y. Let’s select three of the possible values for y: -3, 1, 5. (5,5) (5,1) (5,-3)
Objective 3: Examples • 3a. Graph: y 3 • As demonstrated in the table below, all ordered pairs that are solutions of y 3have a value of ythat is always 3. • Thus, the line is horizontal.
Example (cont) • 3b. Graph: x -2 • As demonstrated in the table below, all ordered pairs that are solutions of x -2 have a value of xthat is always -2. • Thus the line is vertical.