Download
1 / 1
10 likes | 113 Vues
Investigating effects of aluminum on Saccharomyces cerevisiae : A model for laboratory-based investigative teaching Maria Farrell and Emily Schmitt Nova Southeastern University Department of Math, Science, and Technology Ft. Lauderdale, FL. DISCUSSION. INTRODUCTION.

E N D
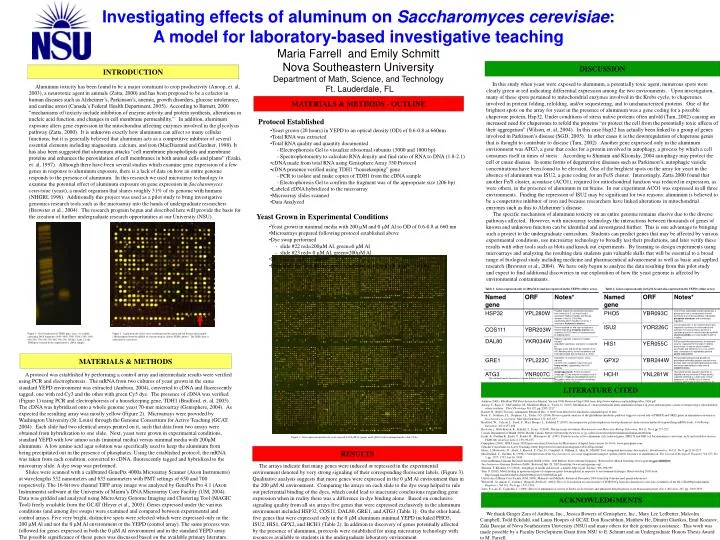
Investigating effects of aluminum on Saccharomyces cerevisiae:A model for laboratory-based investigative teachingMaria Farrell and Emily SchmittNova Southeastern UniversityDepartment of Math, Science, and Technology Ft. Lauderdale, FL DISCUSSION INTRODUCTION In this study when yeast were exposed to aluminum, a potentially toxic agent, numerous spots were clearly green or red indicating differential expression among the two environments. Upon investigation, many of these spots pertained to mitochondrial enzymes involved in the Krebs cycle, to chaperones involved in protein folding, refolding, and/or sequestering, and to uncharacterized proteins. One of the brightest spots on the array for yeast in the presence of aluminum was a gene coding for a possible chaperone protein, Hsp32. Under conditions of stress native proteins often unfold (Tam, 2002) causing an increased need for chaperones to refold the proteins “or protect the cell from the potentially toxic affects of their aggregation” (Wilson, et. al, 2004). In this case Hsp32 has actually been linked to a group of genes involved in Parkinson’s disease (SGD, 2005). In other cases it is the downregulation of chaperone genes that is thought to contribute to disease (Tam, 2002). Another gene expressed only in the aluminum environment was ATG3, a gene that codes for a protein involved in autophagy, a process by which a cell consumes itself in times of stress. According to Shintani and Klionsky, 2004 autophagy may protect the cell or cause disease. In some forms of degenerative diseases such as Parkinson’s, autophagic vesicle concentrations have been found to be elevated. One of the brightest spots on the array for yeast in the absence of aluminum was ISU2, a gene coding for an Fe/S cluster. Interestingly, Zatta 2000 found that another Fe/S cluster, aconitase (ACO1), required for mitochondrial function was reduced in expression, as were others, in the presence of aluminum in rat brains. In our experiment ACO1 was expressed in all three environments. Finding the repression of ISU2 may be significant for two reasons: aluminum is believed to be a competitive inhibitor of iron and because researchers have linked alterations in mitochondrial enzymes such as this to Alzheimer’s disease. The specific mechanism of aluminum toxicity on an entire genome remains elusive due to the diverse pathways affected. However, with microarray technology the interactions between thousands of genes of known and unknown function can be identified and investigated further. This is one advantage to bringing such a project to the undergraduate curriculum. Students can predict genes that may be affected by various experimental conditions, use microarray technology to broadly test their predictions, and later verify these results with other tools such as blots and knock out experiments. By learning to design experiments using microarrays and analyzing the resulting data students gain valuable skills that will be essential to a broad range of biological study including medicine and pharmaceutical advancement as well as basic and applied research (Brewster et al., 2004). We have only begun to analyze the data resulting from this pilot study and expect to find additional discoveries in our exploration of how the yeast genome is affected by environmental contaminants. Aluminum toxicity has been found to be a major constraint to crop productivity (Anoop, et. al, 2003), a neurotoxic agent in animals (Zatta, 2000) and has been proposed to be a cofactor in human diseases such as Alzheimer’s, Parkinson’s, anemia, growth disorders, glucose intolerance, and cardiac arrest (Canada’s Federal Health Department, 2005). According to Barnett, 2000 “mechanisms of toxicity include inhibition of enzyme activity and protein synthesis, alterations in nucleic acid function, and changes in cell membrane permeability.” In addition, aluminum exposure alters gene expression in the mitochondria affecting enzymes involved in the glycolysis pathway (Zatta, 2000). It is unknown exactly how aluminum can affect so many cellular functions, but it is generally believed that aluminum acts as a competitive inhibitor of several essential elements including magnesium, calcium, and iron (MacDiarmid and Gardner, 1998). It has also been suggested that aluminum attacks “cell membrane phospholipids and membrane proteins and enhances the peroxidation of cell membranes in both animal cells and plants” (Ezaki, et. al, 1997). Although there have been several studies which examine gene expression of a few genes in response to aluminum exposure, there is a lack of data on how an entire genome responds to the presence of aluminum. In this research we used microarray technology to examine the potential effect of aluminum exposure on gene expression in Saccharomyces cerevisiae (yeast), a model organism that shares roughly 31% of its genome with humans (NHGRI, 1996). Additionally this project was used as a pilot study to bring investigative genomics research tools such as the microarray into the hands of undergraduate researchers (Brewster et al., 2004). The research program begun and described here will provide the basis for the creation of further undergraduate research opportunities at our University (NSU). MATERIALS & METHODS - OUTLINE Protocol Established • Yeast grown (20 hours) in YEPD to an optical density (OD) of 0.6-0.8 at 660nm • Total RNA was extracted • Total RNA quality and quantity documented • - Electrophoresis Gel to visualize ribosomal subunits (3000 and 1800 bp) • - Spectrophotometry to calculate RNA density and find ratio of RNA to DNA (1.8-2.1) • cDNA made from total RNA using Genisphere Array 350 Protocol • cDNA presence verified using TDH1 “housekeeping” gene • - PCR to isolate and make copies of TDH1 from the cDNA sample • - Electrophoresis Gel to confirm the fragment was of the appropriate size (206 bp) • Labeled cDNA hybridized to the microarray • Microarray slides scanned • Data Analyzed Yeast Grown in Experimental Conditions • Yeast grown in minimal media with 200 mM and 0 mM Al to OD of 0.6-0.8 at 660 nm • Microarrays prepared following protocol established above • Dye swap performed • - slide #22 red=200mM Al, green=0 mM Al • - slide #23 red= 0mM Al, green=200mM Al • Microarray slides scanned • Data analyzed: Ten distinct spots compared among all six arrays (3 slides) Table 1: Genes expressed only in 200 mM Al and not expressed in the YEPD (yellow) array. Table 2: Genes expressed only in 0 mM Al and also expressed in the YEPD (yellow array) Figure 1: Gel Visualization of TDH1 gene. Lane 1 is a ladder containing DNA fragments (5000, 4000, 3000, 2500, 1500, 1000, 900, 800, 700, 600, 500, 400, 300, 200, 100 bp). Lane 2 is the TDH1gene isolated from a representative cDNA sample. Figure 2: A grid from the yellow array resulting from two green and red fluorescently tagged cDNA prepared from the mRNA of yeast growing in similar YEPD cultures. The TDH1 gene is indicated by a red arrow. MATERIALS & METHODS A protocol was established by performing a control array and intermediate results were verified using PCR and electrophoresis. The mRNA from two cultures of yeast grown in the same standard YEPD environment was extracted (Ambion, 2004), converted to cDNA and fluorescently tagged, one with red Cy3 and the other with green Cy5 dye. The presence of cDNA was verified (Figure 1) using PCR and electrophoresis of a housekeeping gene, TDH1 (Bradford, et. al, 2005). The cDNA was hybridized onto a whole genome yeast 70-mer microarray (Genisphere, 2004). As expected the resulting array was mostly yellow (Figure 2). Microarrays were provided by Washington University (St. Louis) through the Genome Consortium for Active Teaching (GCAT, 2004). Each slide had two identical arrays printed on it, such that data from two arrays were obtained from hybridization to one slide. Next, yeast were grown in experimental conditions, standard YEPD with low amino acids (minimal media) versus minimal media with 200mM aluminum. A low amino acid agar solution was specifically used to keep the aluminum from being precipitated out in the presence of phosphates. Using the established protocol, the mRNA was taken from each condition, converted to cDNA, fluorescently tagged and hybridized to the microarray slide. A dye swap was preformed. Slides were scanned with a calibrated GenePix 4000a Microarray Scanner (Axon Instruments) at wavelengths 532 nanometers and 635 nanometers with PMT settings of 650 and 700 respectively. The 16-bit two channel TIFF array image was analyzed by GenePix Pro 4.1 (Axon Instruments) software at the University of Miami’s DNA Microarray Core Facility (UM, 2004). Data was gridded and analyzed using MicroArray Genome Imaging and Clustering Tool (MAGIC Tool) freely available from the GCAT (Heyer et al., 2005). Genes expressed under the various conditions (and among dye swaps) were examined and compared between experimental and control arrays. Five very bright, distinctive spots were selected which were expressed only in the 200 mM Al and not the 0 mM Al environment or the YEPD (control array). The same process was followed for genes expressed in both the 0 mM Al environment and in the standard YEPD array. The possible significance of these genes was discussed based on the available primary literature. * Notes obtained from the Saccharomyces Genome Database (www.yeastgenome.org) LITERATURE CITED Ambion (2004). RiboPure TM Yeast Instruction Manual. Version 0306. Retrieved Sept 2004 from http://www.ambion.com/techlib/prot/fm_1926.pdf Anoop, V., Basu, U., McCammon, M., McAlister-Henn, L., Taylor, G. (2003). Modulation of citrate metabolism alters aluminum tolerance in yeast and transgenic canola overexpressing a mitochondrial citrate synthase. Plant Physiology Vol 132, pp. 2205-2217. Barnett, B. (2002). Toxicity, Aluminum. Retrieved Dec. 3, 2005 from http://www.emedicine.com/med/topic113.htm Basu, U., Southron, J.L., Stephens, J.L., Taylor, G.J. (2004). Reverse genetic analysis of the glutathione metabolic pathway suggests a novel role of PHGPX and URE2 genes in aluminum resistance in Saccharomyces cerevisiae. Mol Gen Genomics 271; 627-637. Bradford, W., Cahoon, L., Freel, S., Mays Hoopes, L., Eckdahl, T. (2005). An inexpensive gel electrophoresis-based polymerase chain reaction method for quantifying mRNA levels. Cell Biology Education, Vol 4;157-168 Brewster, j., Beth Beason, K., Ecktahl, T., Evans, I (2004). The microarry revolution. Biochemistry and Molecular Biology Education. Vol 32, No 4, pp 217-227. Canada Department of Health (2004). Health Canada. Retrieved from http://www.hc-sc.gc.ca/hesc/water/factsheets/aluminum-human-health.htm Ezaki, B., Gardner,R., Ezaki, Y., Kondo, H., Matsumoto, H. (1997). Protective roles of two aluminum (Al)- induced genes, HSP150 and SED1 of Saccharomyces cerevisiae, in Al and oxidative stresses. FEMS Microbiology Letters. 159, 99-105. Genisphere (2004). 3DNA Array 350 Expression Array Detection for Microarrays. Adapted from version 10-19-04. www.genisphere.com Genome Consortium for Active Teaching (2004) http://www.bio.davidson.edu/projects/GCAT/gcat.html Heyer, L.Moskowitz, D., Abele, J., Karnick, P., Choi, D., Campbell, A. Oldham, E. Akin, B., MAGIC Tool: integrated microarray data analysis. Bioinformatics. Vol 21, No 9, pp 2114-2115. MacDiarmid, C., Gardner, R. (1998). Overexpression of the Saccharomyces cerevisiae magnesium transport system confers resistance to aluminum ion. The Journal of Biological Chemistry Vol 273, No 3, pp. 1727- 1732, Jan 16, 1998 National Human Genome Research Institute-NGHI (1996). 1196 Release Yeast Genome Sequence. Retrieved 01-March from http://www.genome.gov/10000510 Saccharomyces Genome Database (SGD). Retrieved July 28, 2005 from http://www.yeastgenome.org/ Shintani, T, Klionsky, D J (2004). Autophagy in health and disease: a double-edge sword. Science, 306, 990-995. Tam, S. (2002). Motif finding in upstream regions of chaperone genes downregulated in response to environmental changes. Retrieved Aug 2005 from http://cmgm.stanford.edu/biochem218/Projects%202002/Tam.pdf University of Miami Core Facility (UM, 2004). Materials and Methods. Retrieved December 2004 from http://chroma.med.miami.edu/arrays/ Wilson,M., St. Amout,C., Collins,J., Ringe,D.,Petsko,G. (2004). The 1.8-A resolution crystal structure of YDR522Cp from Saccharomyces cerevisae: A member of the DJ-1/ThiJ/PfpI superfamily. Biophysics. Vol 101, No 6, pp. 1531-1536 Zatta, P., Lain, E., Cagnolini, C. (2000). Effects of aluminum of activity of Krebs cycle enzymes and glutamate dehydrogenase in rat brain homogenate. Eur. J. Biochem. 267, pp. 3029-3055. Figure 3: Gene expression patterns for yeast exposed to 200 mM Al (green) and 0 mM Al (red) in minimal media (slide # 23b). RESULTS The arrays indicate that many genes were induced or repressed in the experimental environment denoted by very strong signaling of their corresponding florescent labels. (Figure 3). Qualitative analysis suggests that more genes were expressed in the 0 mM Al environment than in the 200 mM Al environment. Comparing the arrays on each slide to the dye swap helped to rule out preferential binding of the dyes, which could lead to inaccurate conclusions regarding gene expression when in reality there was a difference in dye binding alone. Based on conclusive signaling quality from all six arrays five genes that were expressed exclusively in the aluminum environment included HSP32, COS11, DAL80, GRE1, and ATG3 (Table 1). On the other hand, five genes that were expressed only in the 0 mM aluminum minimal YEPD included PHO5, ISU2, HIS1, GPX2, and HCH1 (Table 2). In addition to discovery of genes potentially affected by the presence of aluminum, protocols were established for using microarray technology with resources available to students in the undergraduate laboratory environment. ACKNOWLEDGMENTS We thank Ginger Zara of Ambion, Inc., Jessica Bowers of Genisphere, Inc., Mary Lee Ledbetter, Malcolm Campbell, Todd Eckdahl, and Laura Hoopes of GCAT, Don Rosenblum, Matthew He, Dimitri Giarikos, Emil Kozarov, Zaki Darojat of Nova Southeastern University (NSU) and many others for their generous assistance. This work was made possible by a Faculty Development Grant from NSU to E. Schmitt and an Undergraduate Honors Thesis Award to M. Farrell.